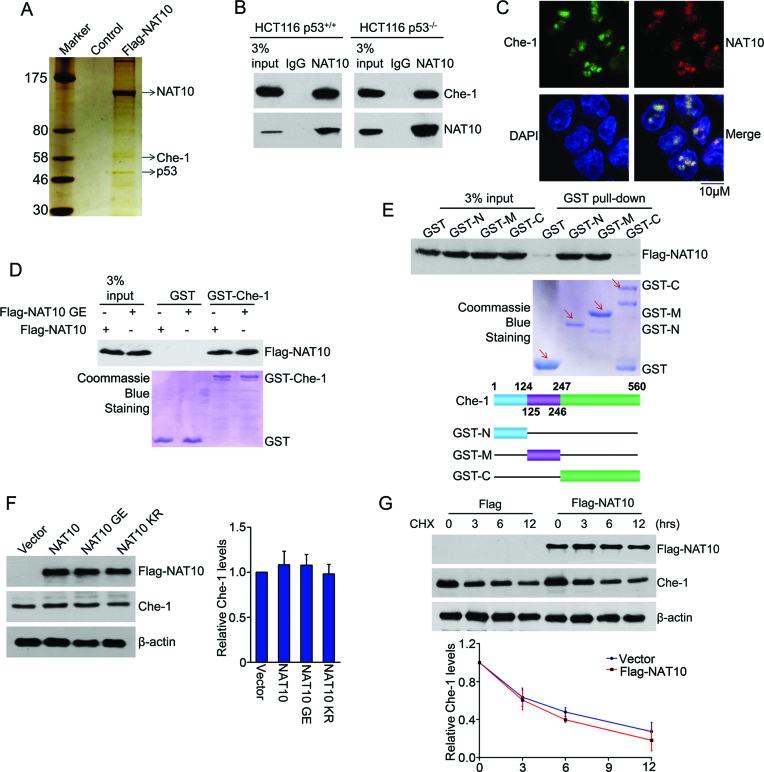
Figure 3.
NAT10 interacts with Che-1. (A) U2OS cells were transfected with Flag-NAT10. After 48 h, the cells were harvested, and whole cell extracts were immunoprecipitated with an anti-Flag antibody affinity resin. NAT10-binding proteins were resolved by SDS-PAGE, detected by silver staining and analyzed by mass spectrometry. (B) HCT116 cell lysates were immunoprecipitated with a control IgG or anti-NAT10 antibody. Immunoprecipitants were immunoblotted with the indicated antibodies. (C) HCT116 cells were fixed, and immunostaining was performed to determine the localization of Che-1 and NAT10. Immunofluorescence images were acquired with a confocal microscope. Scale bars, 10 μM. (D) GST pull-down assay was performed with purified Flag-NAT10 or Flag-NAT10 GE and GST-Che-1 proteins. Che-1-bound Flag-NAT10 was evaluated by Western blot using an anti-Flag antibody. The amounts of GST fusion proteins used in the GST pull-down assay are shown in the lower panel. (E) GST pull-down assay was performed with purified Flag-NAT10 and GST-Che-1 or its deletion mutants. Che-1-bound Flag-NAT10 was evaluated by Western blot using an anti-Flag antibody (upper). The amounts of GST fusion proteins used in the GST pull-down assays are shown (middle). The schematic diagram represents the GST-Che-1 deletion mutant constructs (lower). (F) HCT116 cells were transfected with the indicated plasmids. Twenty-four hours later, the cells were harvested, and proteins from the cell lysates were subjected to immunoblot analysis for the evaluation of Che-1 and NAT10. Beta-actin was evaluated as a loading control. Error bars indicate the SEM (n = 3) (right panel). (G) HCT116 cells were transfected with the Flag-NAT10 or Flag plasmids. Twenty-four hours later, the cells were treated with cycloheximide (CHX) and harvested at the indicated time points. Proteins from the cell lysates were subjected to immunoblot analysis for the evaluation of NAT10 and Che-1. Beta-actin was evaluated as a loading control (upper panels). Relative Che-1 levels standardized to β-actin at different time points are shown in the lower panel. Error bars indicate the SEM (n = 3).

