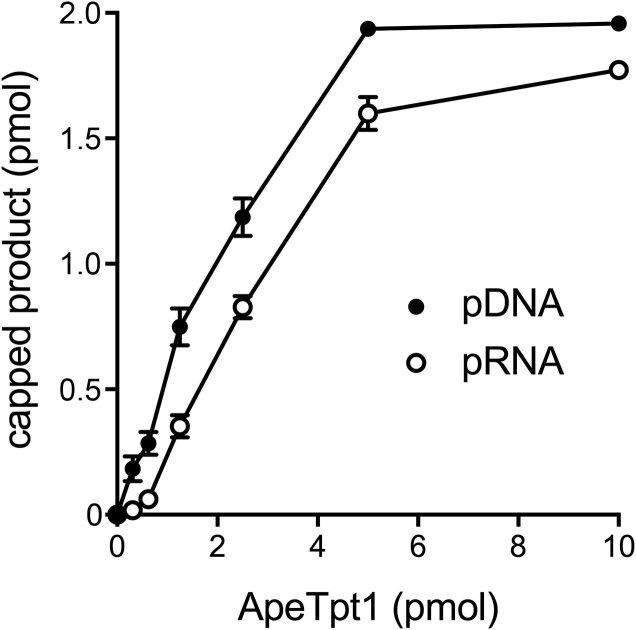
Figure 4.
Dependence of pDNA and pRNA capping on ApeTpt1 concentration. Reaction mixtures (10 μl) containing 100 mM Tris–HCl (pH 7.5), 0.2 μM (2 pmol) 5′ 32P-labeled 10-mer pDNA or pRNA substrates, 1 mM NAD+, and ApeTpt1 as specified were incubated at 37°C for 60 min. The extents of pDNA and pRNA capping are plotted as a function of input ApeTpt1. Each datum in the graph is the average of three separate enzyme titration experiments ±SEM.

