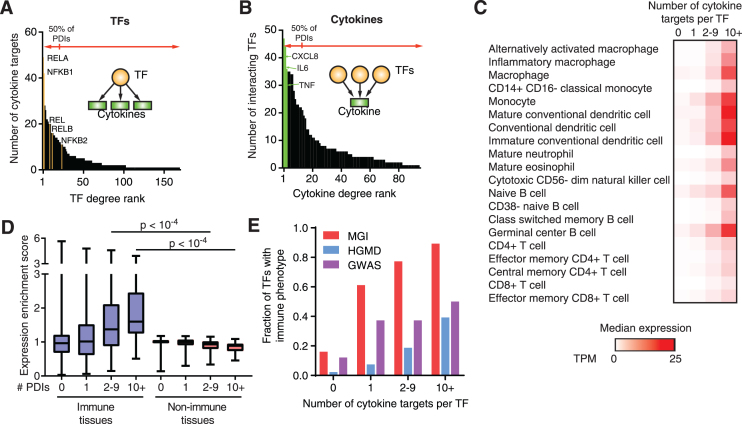
Figure 2.
Relationship between TF connectivity and phenotype in the human cytokine GRN. (A) Number of cytokine targets per TF (TF degree) in the human cytokine GRN ordered by TF degree rank. (B) Number of interacting TFs per cytokine (cytokine degree) in the human cytokine GRN ordered by cytokine degree rank. (C) Median expression as transcripts per million (TPM) across human immune cells obtained from the Blueprint Epigenome Consortium for TFs displaying different numbers of cytokine targets. (D) Expression enrichment in human immune tissues versus non-immune tissues for TFs with varying numbers of cytokine targets. Each box spans from the first to the third quartile, the horizontal lines inside the boxes indicate the median value and the whiskers indicate minimum and maximum values. Statistical significance determined using two-tailed Wilcoxon matched-pair ranked sign test. (E) Fraction of TFs in the human cytokine GRN with annotated immune phenotypes when knocked out in mice (MGI), or associated with immune disorders in the Human Gene Mutation Database (HGMD) or in genome-wide association studies (GWAS) based on the number of cytokine targets.

