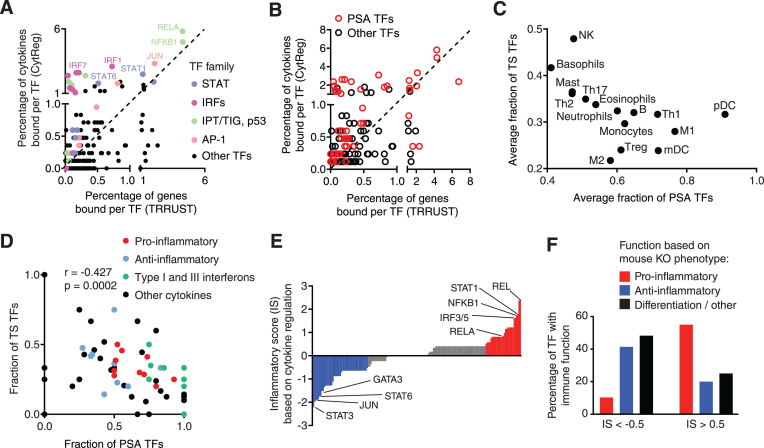
Figure 3.
Cytokine regulation by different types of TFs. (A, B) Correlation between the percentage of PDIs involving a TF in the human cytokine GRN versus a global human GRN annotated in TRRUST, for different TF families (A) or for pathogen- or stress-activated (PSA) TFs (B). (C) Average fraction of PSA and tissue-specific (TS) TFs for cytokines expressed in different cell types. (D) Fraction of PSA and TS TFs for different classes of cytokines. Correlation determined by Pearson correlation coefficient. (E) Inflammatory score (IS) for each TF based on the fraction of PDIs with pro- and anti-inflammatory cytokines. (F) Percentage of TFs with pro-inflammatory, anti-inflammatory, and differentiation or other functions based on mouse knockout phenotypes. P = 0.009 by Fisher's exact test.

