Figure 4.
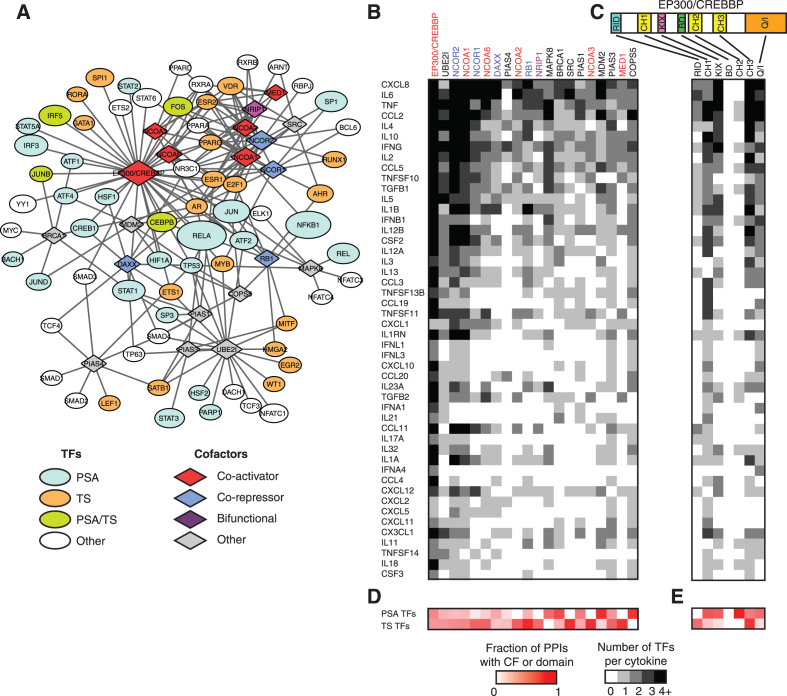
Cooperativity and plasticity in cytokine regulation. (A) Protein-protein interaction network from Lit-BM-13 between cofactors and TFs in the human cytokine GRN. Ellipses – TFs, diamonds – cofactors. Node size indicates the number of cytokine targets (for TFs) in the cytokine GRN, and the number of protein-protein interactions with TFs (for cofactors). Only cofactors with five or more protein-protein interactions are shown. (B, C) Number of TFs (shades of grey) interacting with each human cytokine gene that interact with the different cofactors (B) or the different domains of EP300/CREBBP (C). (D, E) Fraction of cofactor (D) or EP300/CREBBP domain (E) protein-protein interactions (shades of red) involving PSA or TS TFs. Only cytokines and cofactors with five or more interactions are shown. Co-activators are shown in red font, co-repressors in blue font, and bifunctional cofactors in purple font.

