Figure 7.
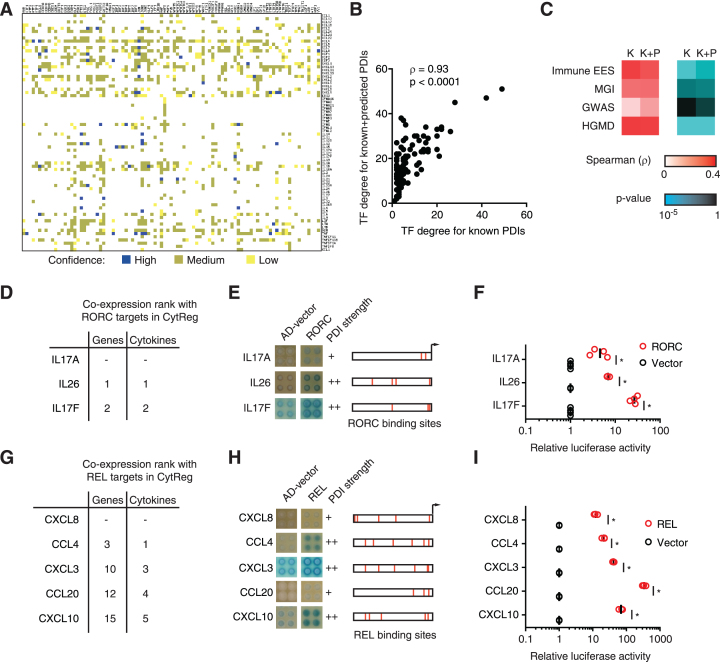
Prediction of novel PDIs in the human cytokine GRN. (A) Novel PDI predictions based on co-expression between cytokines and known cytokine targets of each TF (determined using the SEEK database), and motifs analysis. Prediction confidence, as defined in the methods section, is shown. (B) Correlation between the number of cytokine targets (TF degree) for known PDIs and known + predicted PDIs. Correlation determined by Spearman's rank correlation coefficient. (C) Correlation between TF degree for known (K) or known + predicted (K+P) PDIs and expression enrichment score (EES) in immune tissues, mouse immune phenotype (MGI), and human immune disorders in GWAS and HGMD. Correlation and significance determined by Spearman's rank correlation coefficient. (D, G) Top predicted cytokine targets of RORC (D) and REL (G). The co-expression rank among all genes and among cytokines is shown. CXCL8 is a known target of REL, while IL17A is a known target of RORC. (E, H) Enhanced yeast one-hybrid assays testing PDIs between the indicated human cytokine promoters and RORC (E) and REL (H). AD-vector corresponds to empty vector. The qualitative strength of PDIs compared to AD-vector control are indicated as –, +, ++ and +++ corresponding to no, weak, medium, and strong interaction, respectively. REL and RORC binding sites are indicated in red for each 2 kb promoter region. (F, I) Luciferase assays in HEK293T cells co-transfected with reporter plasmids containing the indicated cytokine promoter region (2 kb) cloned upstream of the firefly luciferase reporter gene, and expression vectors for RORC (F) or REL (I) (fused to the activation domain VP160). After 48 h, cells were harvested and luciferase assays were performed. Relative luciferase activity is plotted as fold change compared to cells co-transfected with the vector control (1.0). Experiments were performed 3–4 times in three replicates. Individual data points represent the average of the three replicates, the average of all experiments is indicated by the black line. *P < 0.05 by one-tailed Student's t-test with Benjamini–Hochberg correction.

