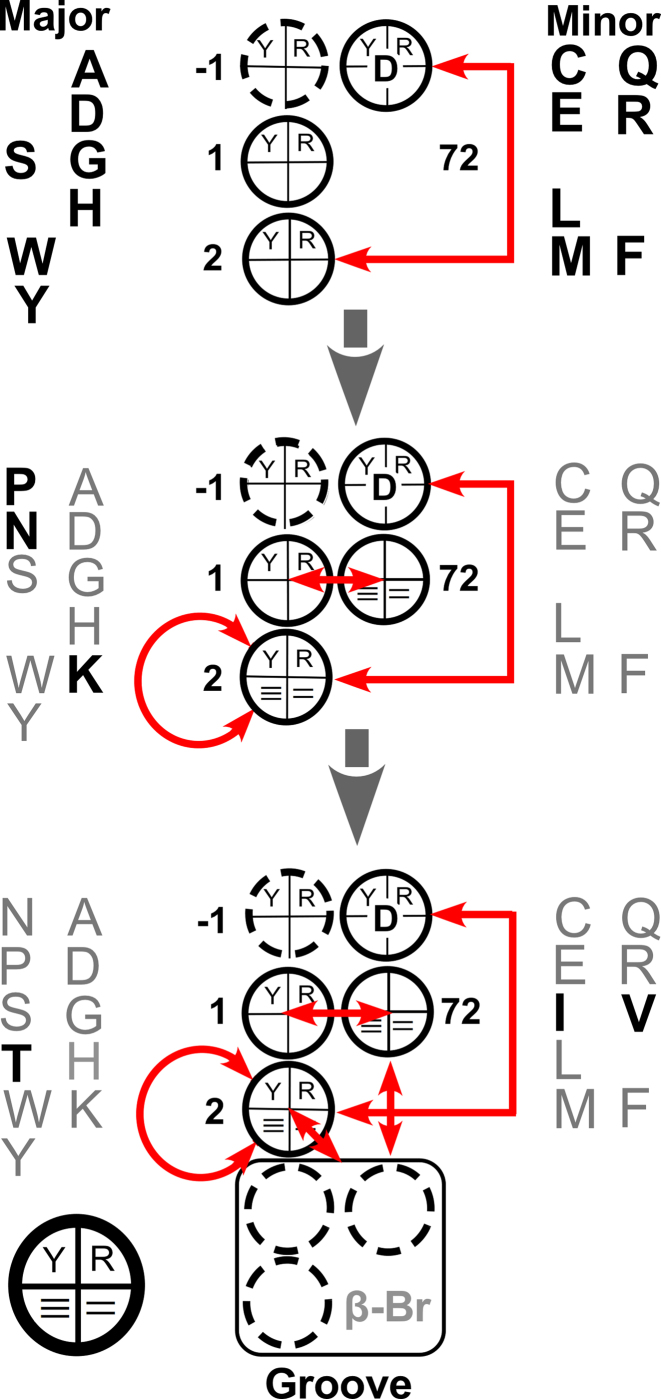
Figure 5.
Hierarchy in regression models for groove recognition. Coefficients are diagrammed schematically using a circle to represent each base, as indicated by the key at the bottom left. Each circle is divided into quadrants. The top two quadrants represent the choice between pyrimidine and purine; the bottom the number of hydrogen bonds made when the base pairs. Red arrows indicate two-way interactions. The grooves recognized by fourteen of the twenty aaRS can be predicted (perfectly) using only three coefficients (top). Additional amino acids (bold) require additional coefficients, indicated in the middle and bottom schemes. The hierarchy does not necessarily imply an evolutionary succession.

