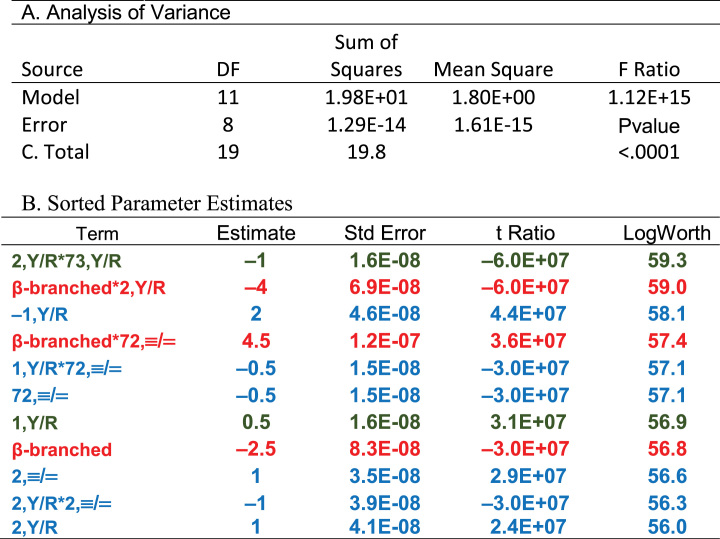
Table 2.
Statistics for the regression model in Figure 2. A. Analysis of variance. B. Coefficients of the regression model and their statistical significance. The logWorth is equal to the negative base10 logarithm of the P value. Colors in Table 2B highlight a hierarchical partition of coefficients. Green entries are presumably the oldest and account for 14 of the 20 canonical amino acids; red and blue entries came later to encode distinctions between β-branched amino acids (red) and asn, pro, and lys (blue), as discussed in the section on hierarchies.

|
