Figure 4.
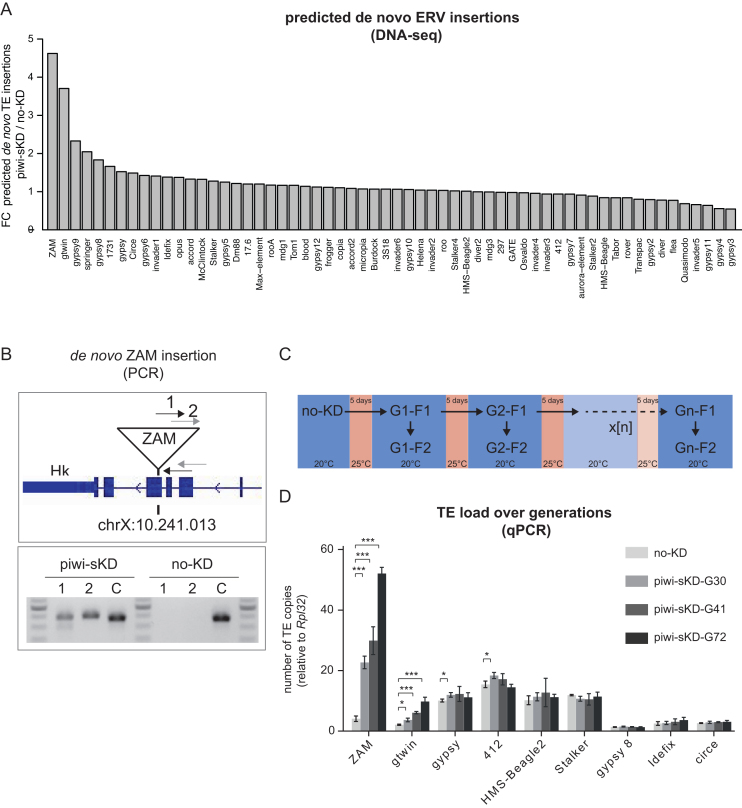
Somatic piwi depletion may lead to de novo ERV insertions in the offspring genome, with a transposition rate stable over generations. (A) Bar plot displaying the ratio of de novo insertions per ERV family (n = 62) in embryos of the F2 generation after piwi-sKD versus no-KD embryos. (B) PCR-validation of a de novo ZAM insertion detected by DNA-seq at position chrX:10.241.013. gDNA from flies, of the F2 generation after piwi-sKD, in which the de novo ZAM insertion was detected and, as control, their no-KD ancestors was used. The upper panel shows a schematic representation of the genomic location of the de novo ZAM insertion with the two primer pairs spanning the break point between the 5′ end of the insertion and the genome. The lower panel shows the PCR products on agarose gel. Primer pair 1 and 2 detect the de novo ZAM insertion at position chrX:10.241.013 and a control primer pair C detects a fixed ZAM insertion (detected in all our libraries) at position chr2L:19.841.922. (C) Schema depicting the experimental set up of the single and successive piwi-sKD. (D) Bar plot displaying the TE load for the depicted ERVs in no-KD and after 30, 41 and 72 generations of successive piwi-sKD (G30, G41 and G72). The F2 generation after the last piwi-sKD was analyzed by qPCR. The mean and standard deviation from three biological replicates is shown. The P-values where calculated with a two-tailed t-test (*P < 0.05, **P < 0.01, ***P < 0.001).

