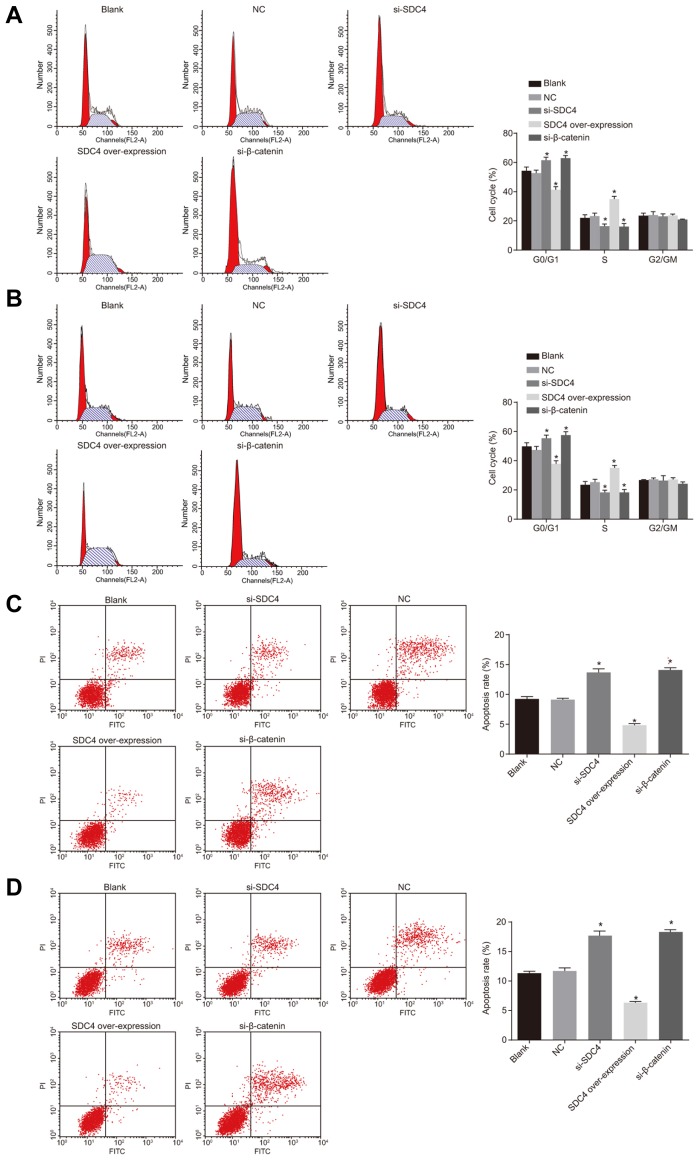
Fig. 6. Flow cytometry analysis shows that SDC4 gene silencing triggers apoptosis and inhibits cell cycle progression in PTC cells.
(A) The percentage of PI-stained cells at the G0/G1, S, and G2/M phases in K1 cell line. (B) The percentage of PI-stained cells at the G0/G1, S, and G2/M phases in TPC-1 cell line. (C) Cell apoptosis rate in K1 cell line. (D) Cell apoptosis rate in TPC-1 cell line; SDC4, Syndecan 4; PTC, papillary thyroid carcinoma; PI, propidium podide; NC, negative control; ANOVA, analysis of variance; *p < 0.05, vs. the blank group; #p < 0.05, vs. the si-SDC4 group; the experimental data were measurement data; the histograms were plotted based on the analyses by the one-way ANOVA; the experiment was repeated 3 times.

