Figure 3.

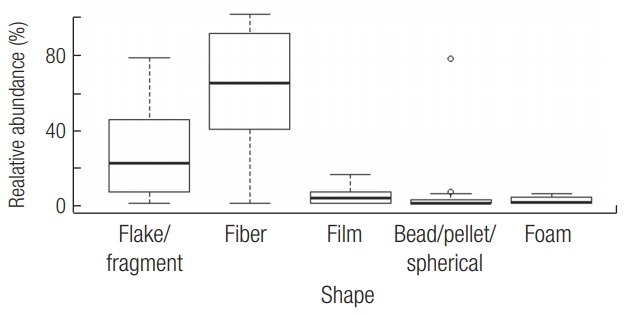
Relative abundance in percent of shapes of microplastics identified in STP influents and effluents. Minimum, 25 percentile, median, 75 percentile, and maximum values from ref 28, 29, 31, 33, 34 are presented in the box plot.

Relative abundance in percent of shapes of microplastics identified in STP influents and effluents. Minimum, 25 percentile, median, 75 percentile, and maximum values from ref 28, 29, 31, 33, 34 are presented in the box plot.