
Figure 3.
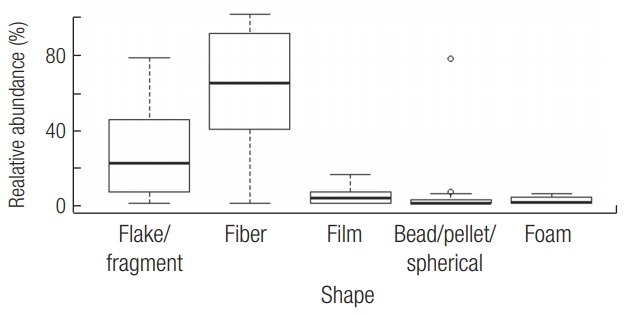
Relative abundance in percent of shapes of microplastics identified in STP influents and effluents. Minimum, 25 percentile, median, 75 percentile, and maximum values from ref 28, 29, 31, 33, 34 are presented in the box plot.
Official websites use .gov
A
.gov website belongs to an official
government organization in the United States.
Secure .gov websites use HTTPS
A lock (
) or https:// means you've safely
connected to the .gov website. Share sensitive
information only on official, secure websites.
Relative abundance in percent of shapes of microplastics identified in STP influents and effluents. Minimum, 25 percentile, median, 75 percentile, and maximum values from ref 28, 29, 31, 33, 34 are presented in the box plot.