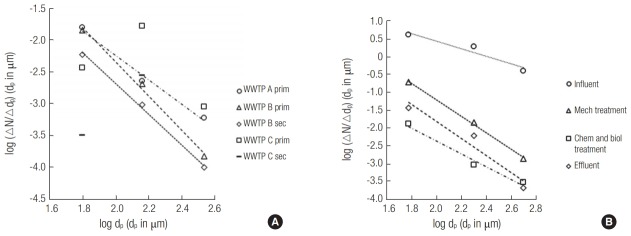
Figure 4.
Microplastic particle size distribution in (A) primary and secondary effluents from three wastewater treatment plants (WWTP) by Ziajahromi et al. [31] and in (B) influent and effluents after mechanical treatment, chemical and biological treatment, and final effluent by Talvitie et al. [37]. Dashed lines are best-fit using linear regression.

