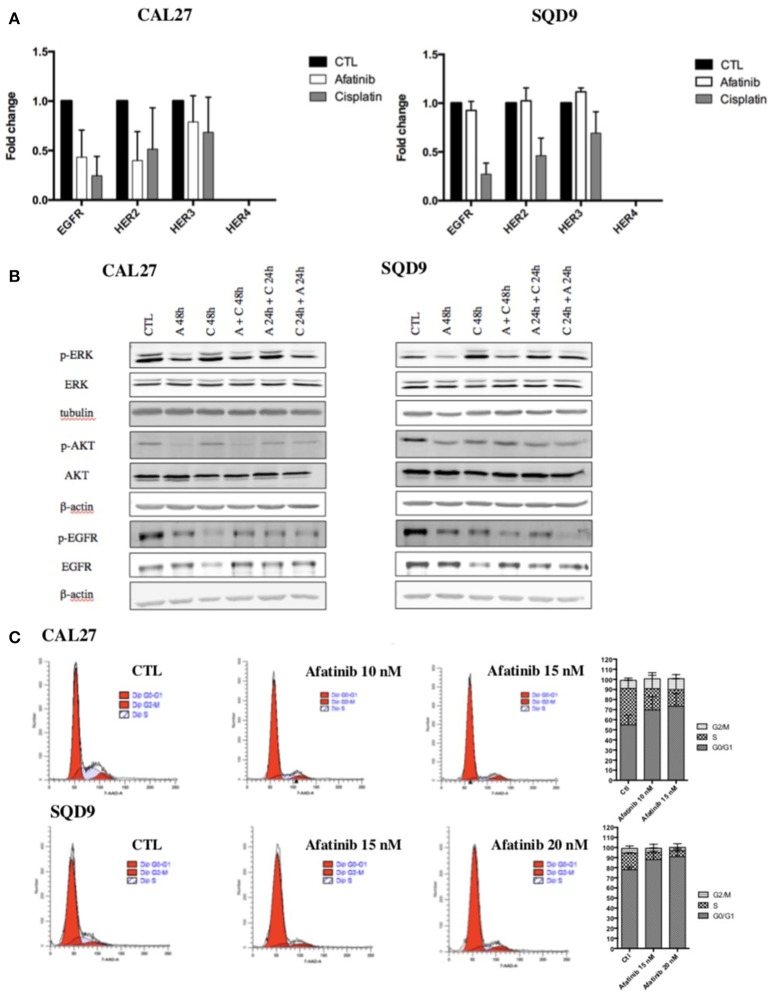
Figure 2.
Effects of afatinib and cisplatin incubation on ErbB family receptor mRNA expression, EGFR signaling pathways and cell cycle distribution in Cal27 and SQD9 cells. (A) Cells were incubated with cisplatin or afatinib at IC20 for 24 h. Total RNA was extracted and reverse transcription was performed before mRNA expression level analysis by RT-qPCR. 23 kDa was used as housekeeping gene. Graphs showed the values of fold induction compared to cells incubated with no drug (CTL). Values are presented as mean ± SD (n = 3; B) Cells were incubated with the different sequences of cisplatin and/or afatinib for 48 h. Cell lysates were analyzed by western blot analysis. β-actin was used as a loading control. (C) Cal27 cells were incubated with afatinib at 10 nM and 15 nM and SQD9 cells were exposed to afatinib at 15 nM and 20 nM for 24 h. Then, cells were fixed and stained with 7-AAD and DNA content was measured by flow cytometry analysis. Cells were divided in 3 groups: G0/G1 phase (2n), S phase (2n−4n) and G2/M phase (4n). One representative experiment is shown for each cell line. Graphs show the percentage of cells in each cell cycle phase. Values are presented as mean ± SD (n = 3).

