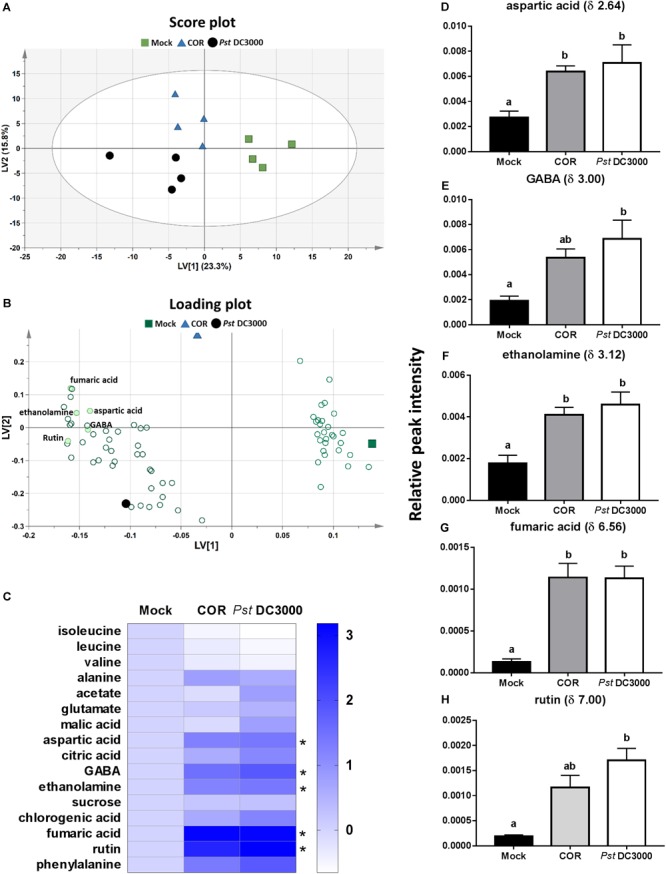
FIGURE 4.

Metabolome responses of tomato plants to COR and Pst DC3000 infiltration. Leaf metabolites were analyzed on tomato leaves infiltrated with coronatine (COR), Pseudomonas syringae pv. tomato DC3000 (Pst DC3000), or a mock solution (mock) by NMR at 7 days after the initial treatment. Partial least square-discriminant analysis (PLS-DA) was performed based on 1H-NMR spectra (n = 4 individual plants), and resulted in five latent variables (LVs) that cumulatively explained 74.6% of the total metabolomic variation and 91.1% of the treatment response, with a 40.7% total model predictability. (A) Score plot showing the first two LVs. The ellipse represents the Hotelling T2 with 95% confidence in score plot. (B) Loading plot showing important metabolites contributing most to the model (VIP score > 1). (C) Heatmap of the identified 16 compounds. Each of the three Heatmap columns represents the log2 fold change of relative peak intensity from one of the treatments Mock, COR, or Pst DC3000 in comparison to Mock. Thus, all log2 fold change of compounds in mock treatment was 0 (fold change = 1) as shown in the first column. (D–H) Relative peak intensities (mean ± SEM, n = 4) of five metabolites (aspartic acid, GABA, ethanolamine, fumaric acid, and rutin) identified in the 1H NMR spectra that significantly differed among treatments. Different letters indicate significant differences among treatments tested by Mann–Whitney U test, P < 0.05.
