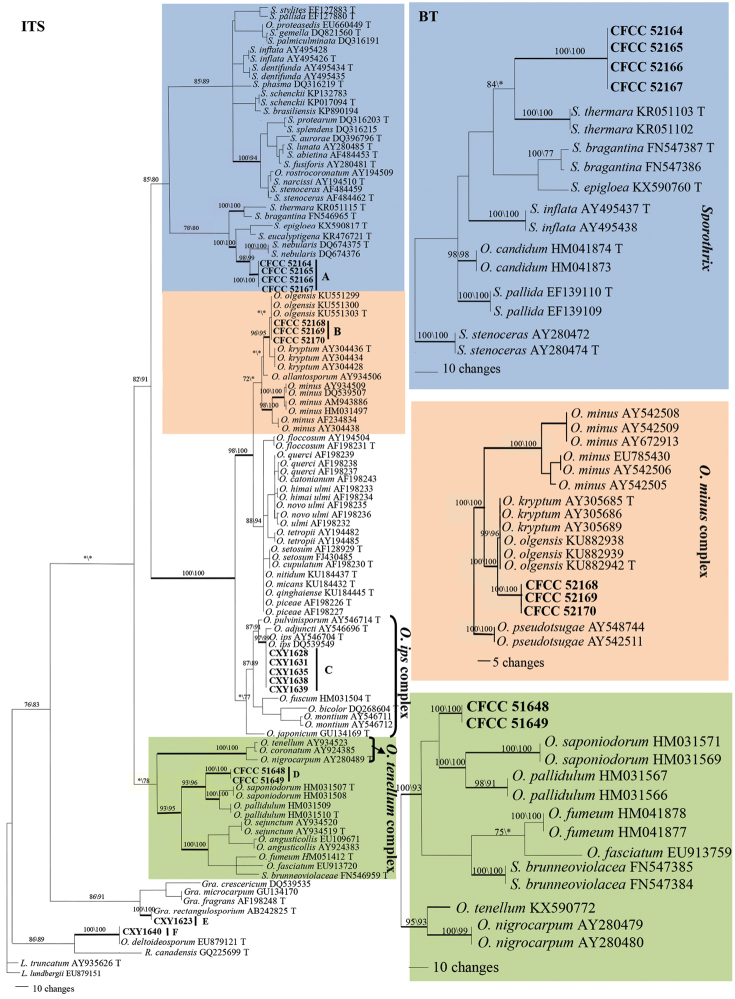
Figure 1.
Phylograms of fungal associates of pine infected by PWN and Monochamusalternatus in China. The phylograms were generated after MP analysis of the ITS1–5.8S–ITS2 rDNA and partial tub2 sequences. Novel sequences obtained in the current study are indicated in bold type. MP bootstrap values (10,000 replicates) and ML bootstrap support values (1000 replicates) (normal type) above 70% are indicated at the nodes. Values below 70% are indicated by asterisk (*). Posterior probabilities (above 90%) obtained from BI are indicated by bold lines at the relevant branching points. Scale bar, total nucleotide differences between taxa; ML, maximum likelihood; MP, maximum parsimony; BI, Bayesian inference.

