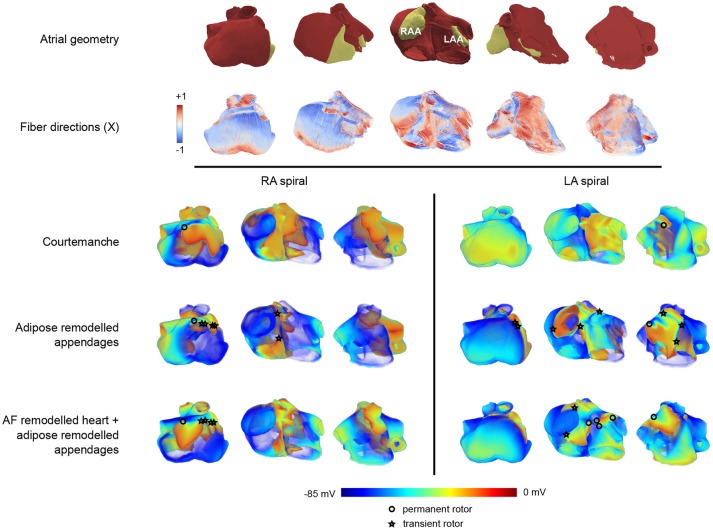
Figure 5.
Arrhythmia patterns in three dimensional realistic atria.The top two rows of panels show the configuration in five different orientations. The top row provides a view on the geometry of the atria where the appendages are colored in yellow, and the remaining part of the atria is colored in red. The second row provides the corresponding fiber orientation colored according to its orientation along one of the axes (X). In these five panels, the leftmost orientation provides a view on the right atrium, while the rightmost one provides a view on the left atrium. The panels in between show a rotation between those two configurations showing the front view of the atria. In the voltage maps at the bottom only the leftmost, middle, and rightmost configuration are presented. The three lower rows (split into two columns) show one frame out of an S1-S2 induced arrhythmia in three different orientations. Each row corresponds to the tissue types that were used (Courtemanche, Courtemanche + adipose remodeled appendages, AF Courtemanche + AF and adipose remodeled appendages). Each column corresponds to the location where the arrhythmia was initialized (in the right atrium, or in the left atrium). One can see different kinds of electrical wave propagation complexity for the different combinations present. The cores of spirals are denoted by either circles or stars. The circle denotes a rotor that remains during the whole arrhythmia simulation. The star indicates that the rotor disappears over the course of time.

