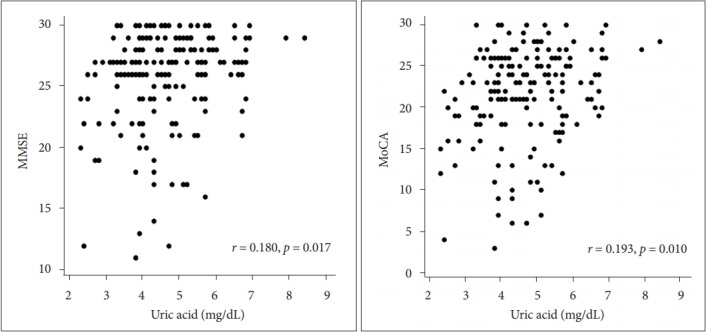
Figure 2.

Age-adjusted scatterplots of the relationship between sUA and MMSE and MoCA scores. r: Pearson’s partial correlation coefficient. X-axes are based on calculated residuals from regressing sUA on age. Y-axes are based on calculated residuals from regressing MMSE and MoCA scores on age. sUA: serum uric acid, MMSE: MiniMental State Examination, MoCA: Montreal Cognitive Assessment.
