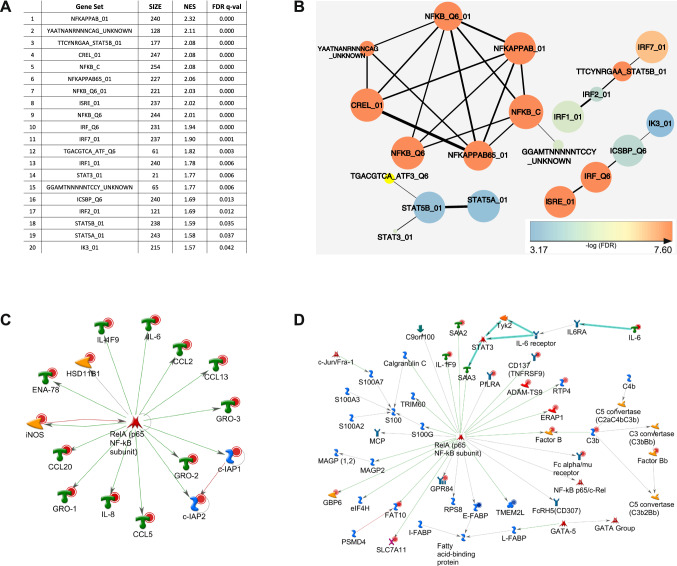
Fig. 5.
Bioinformatic analyses of genes with upregulated expression points towards a role of the NF-κB signaling pathway. a Top 20 results of GSEA against C3 tft (transcription factor target genes) v6.0 database in the order of normalized enrichment score (NES). GS gene set, SIZE size of the gene set, FDR false discovery rate. b Cytoscape enrichment map visualization of significant C3.tft v6.0 GSEA results. Nodes are colored according to FDR values (please see calibration scale, bottom left). Size of the nodes is proportional to the number of genes within each gene set. Line thickness indicates the extent of gene set overlap. c The 20 top regulated genes (according to |log2FC|-values) were subjected to Metacore’s transcription regulation algorithm, resulting in the scheme of the top scoring network according to the p value: ‘RelA p65 NF-κB subunit’. All genes presented were upregulated, as indicated by red circles. All connections shown correspond to fragments of canonical pathways. Colors of connections indicate types of interactions (as advised by Metacore): green: activation, red: inhibition, grey: unspecified. d The list of genes (|log2FC| > 2 and adjusted p < 0.05 including fold-changes and p values) was processed by the Metacore ‘generate network’ algorithm, allowing a maximum of 50 items per calculated network. The network ‘FAT10, Factor B, Fc α/μ receptor, ERAP1 and E–FABP’ is presented. The same color coding as in panel c applies to displaying genes and interactions

