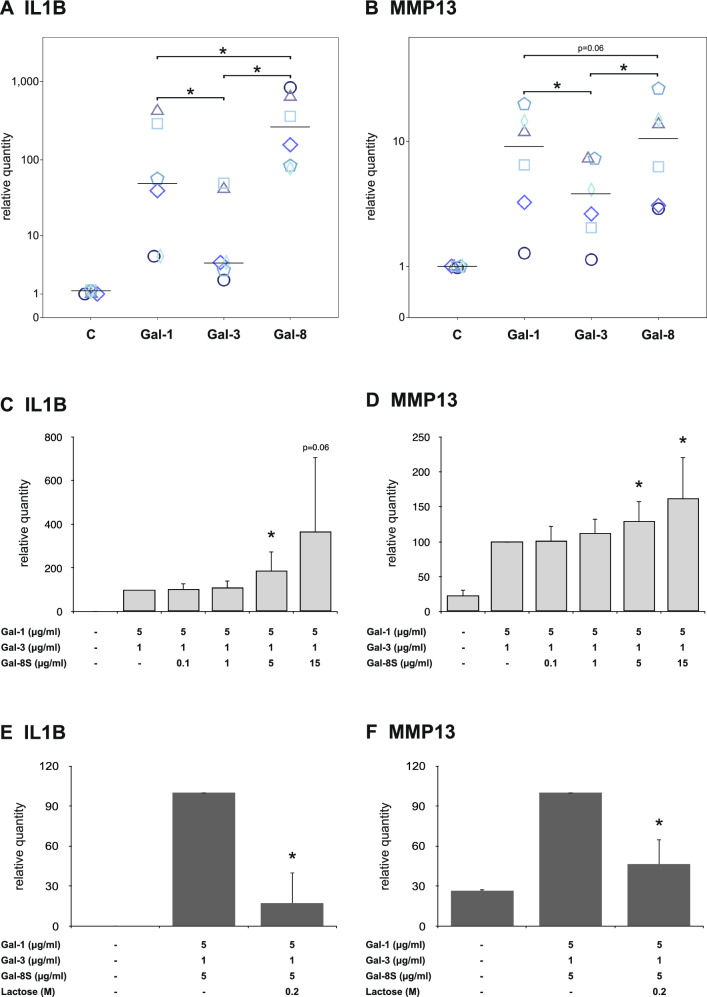
Fig. 7.
Functional cooperation between Gal-8, Gal-1 and Gal-3 in OA chondrocytes. a, b Chondrocytes of six OA patients were starved overnight prior to treatment with Gal-1 (10 µg/ml), Gal-3 (18 µg/ml) and Gal-8 (24 µg/ml) for 24 h. Total RNA was isolated and mRNA expression levels of IL1B (a) and MMP13 (b) were determined using RT-qPCR. Results are presented as dotplots showing values for cells of each patient as relative quantities with respect to untreated controls set to 1. The median values are indicated for Gal-1, -3, and -8 treatment. *p < 0.05 [Wilcoxon signed-rank test (panel a) or paired t test (panel b)]. c–d Chondrocytes of six OA patients were starved overnight prior to treatment with 5 µg/ml Gal-1 and 1 µg/ml Gal-3 together with increasing concentrations of Gal-8 for 24 h. Total RNA was isolated and mRNA levels of IL1B (c) and MMP13 (d) were determined using RT-qPCR. Results are expressed as relative quantities (mean ± SD) with respect to cells treated with 5 µg/ml Gal-1 and 1 µg/ml Gal-3 set to 100. The value for the untreated control in panel c is 0.3 ± 0.5. *p < 0.05 (paired t test vs cells treated with 5 µg/ml Gal-1 and 1 µg/ml Gal-3). e, f Chondrocytes of three OA patients were treated with a mixture of 5 µg/ml Gal-1, 1 µg/ml Gal-3, and 5 µg/ml Gal-8 for 24 h in the absence or presence of 0.2 M lactose. Total RNA was isolated and mRNA levels of IL1B (e) and MMP13 (f) were determined using RT-qPCR. Results are expressed as relative quantities (mean ± SD) with respect to cells treated with 5 µg/ml Gal-1, 1 µg/ml Gal-3, and 5 µg/ml Gal-8S set to 100. The value for the untreated control in panel E is 0.3 ± 0.2. *p < 0.05 (paired t test vs cells treated with 5 µg/ml Gal-1, 1 µg/ml Gal-3, and 5 µg/ml Gal-8S)

