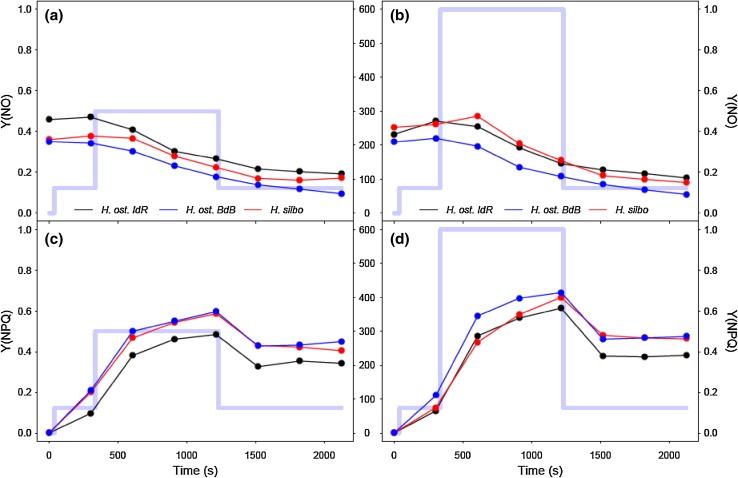
Fig. 5.
Excitation dissipation responses of H. ostrearia strain Île de Ré (H. ost. IdR), H. ostrearia strain Baie de Bourgneuf (H. ost. BdB), and H. silbo sp. nov. ined., during low light (left column) and high light (right column) induction and recovery curves. Both non-regulated (Y[NO], a, b) and regulated (Y[NPQ], c, d) excitation dissipation components are shown. Background trace (light blue line) shows the respective light levels (central axes, PAR µmol photons m−2 s−1) applied at each light step

