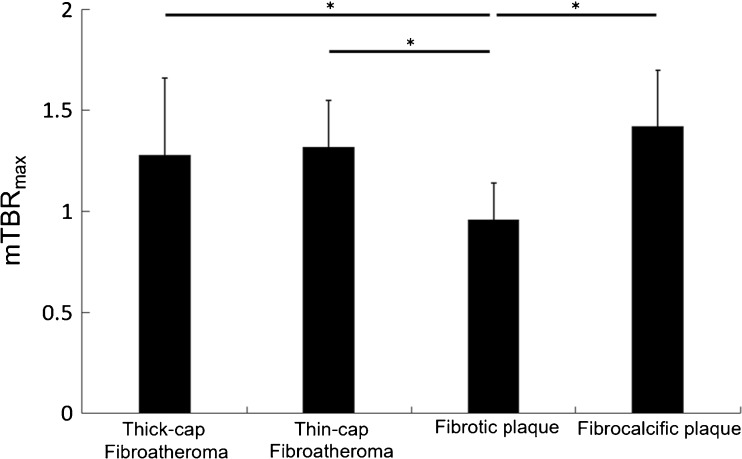
Fig. 4.
Statistical 18F-NaF uptake ratios (mTBRmax) distribution within different types of atherosclerotic lesions (n = 69). Significantly increased uptake was observed at thick-cap (n = 21) and thin-cap fibroatheromas (n = 22) with a large necrotic core, as well as in fibrocalcified (n = 8) plaques compared to fibrotic plaques (n = 18) with less lipid necrotic tissue. mTBRmax: mean of TBRmax derived from all lesions in each defined group. *p value <0.05

