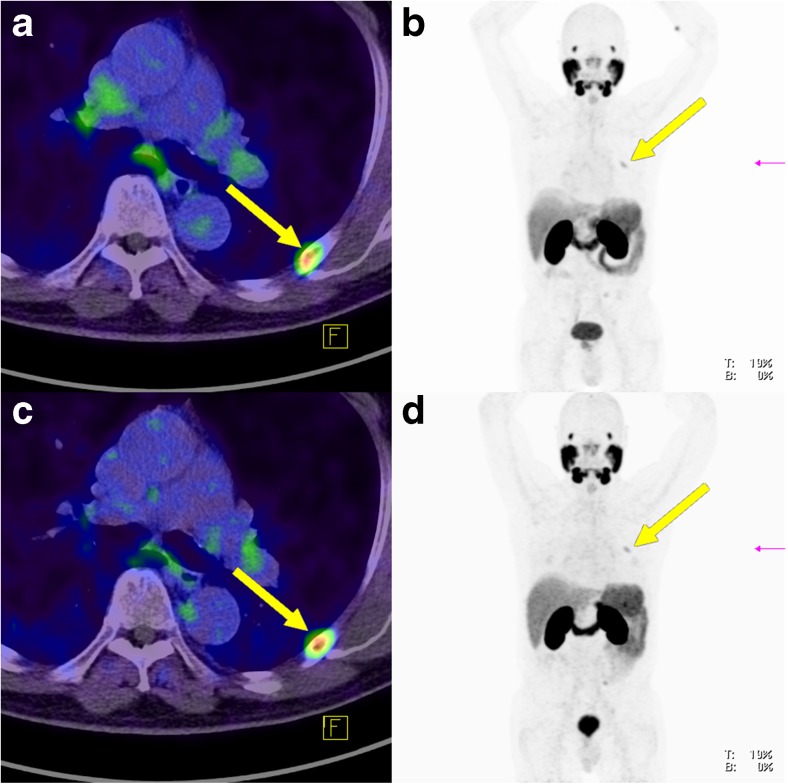
Fig. 8.
Bone metastasis in an example patient (patient 6; yellow arrows; lesion 16 in Fig. 2) visible on both PET-1 and PET-2 with similar tracer uptake despite a complete PSA response (0.01 ng/ml) to ADT (a, b PET-1 without ADT; c, d PET-2 during ongoing ADT 270 days after the first scan). a Fused PET and CT image without ADT. b Low-dose CT image without ADT. c Fused PET and CT image during ongoing ADT. d Low-dose CT image during ongoing ADT

