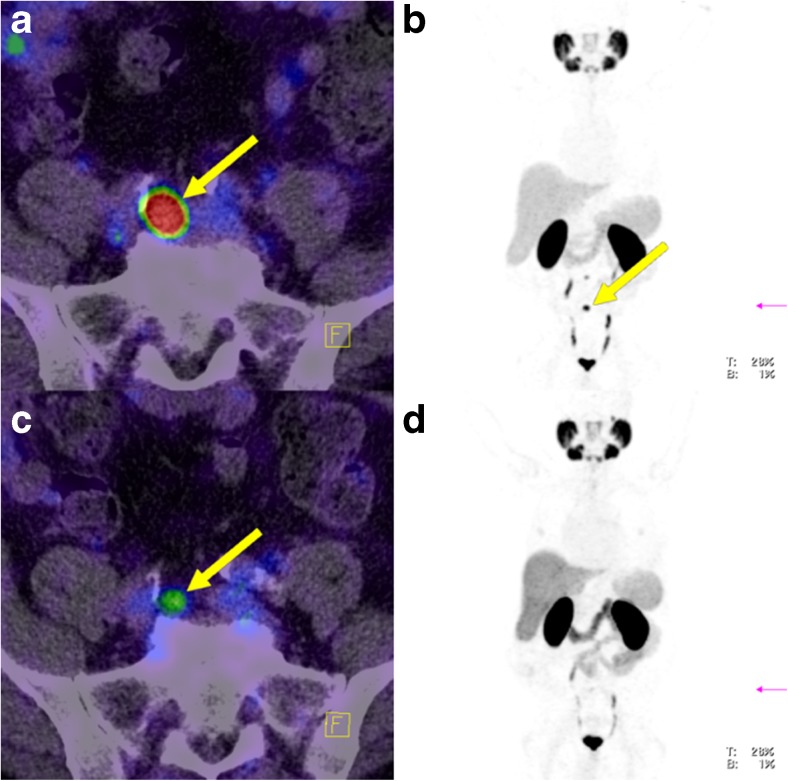
Fig. 9.
Lymph node metastasis in an example patient (patient 9; yellow arrows) clearly visible on PET-1 without ADT (a, b) which became significantly less visible on PET-2 with a complete PSA response to ADT (c, d). a Fused PET and CT image without ADT. b Maximum intensity projection image of the PET data without ADT. c Fused PET and CT image during ongoing ADT. d Maximum intensity projection image of the PET data during ongoing ADT

