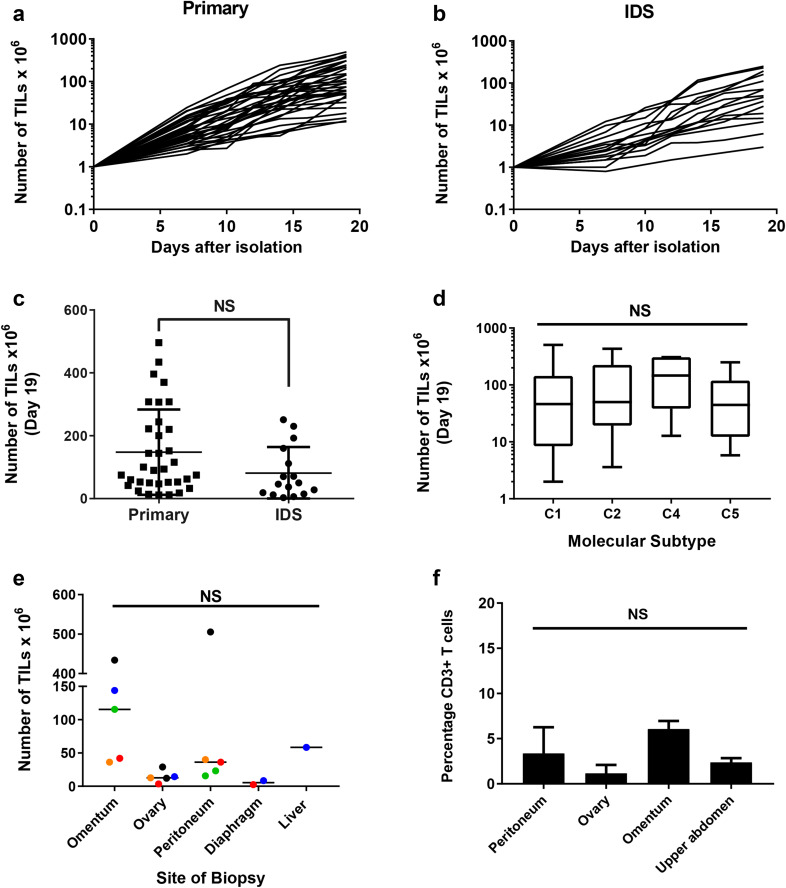
Fig. 1.
Expansion of TILs from epithelial ovarian cancer biopsies. a Growth profiles of TILs during the 19-day initial culture period, isolated from patients undergoing primary surgery or b interval debulking surgery (IDS) following neo-adjuvant chemotherapy. Data are shown on a logarithmic scale. c Comparison of the number of TILs expanded from biopsies taken at primary surgery and IDS. Mean and SD are shown. p < 0.05, NS not significant, Student’s t test. d Comparison of the number of TILs expanded from the four distinct molecular subtypes of ovarian cancer (C1—mesenchymal; C2—immune; C4—differentiated; C5—proliferative) [35]. Data represent the median, upper and lower quartiles and range. e Comparison of number of TILs expanded from biopsies taken from different anatomical sites of disease from five patients. Colours denote individual patients; one-way Anova. f Percentage of CD3 T cells in the tumour disaggregates from different anatomical sites; one-way Anova

