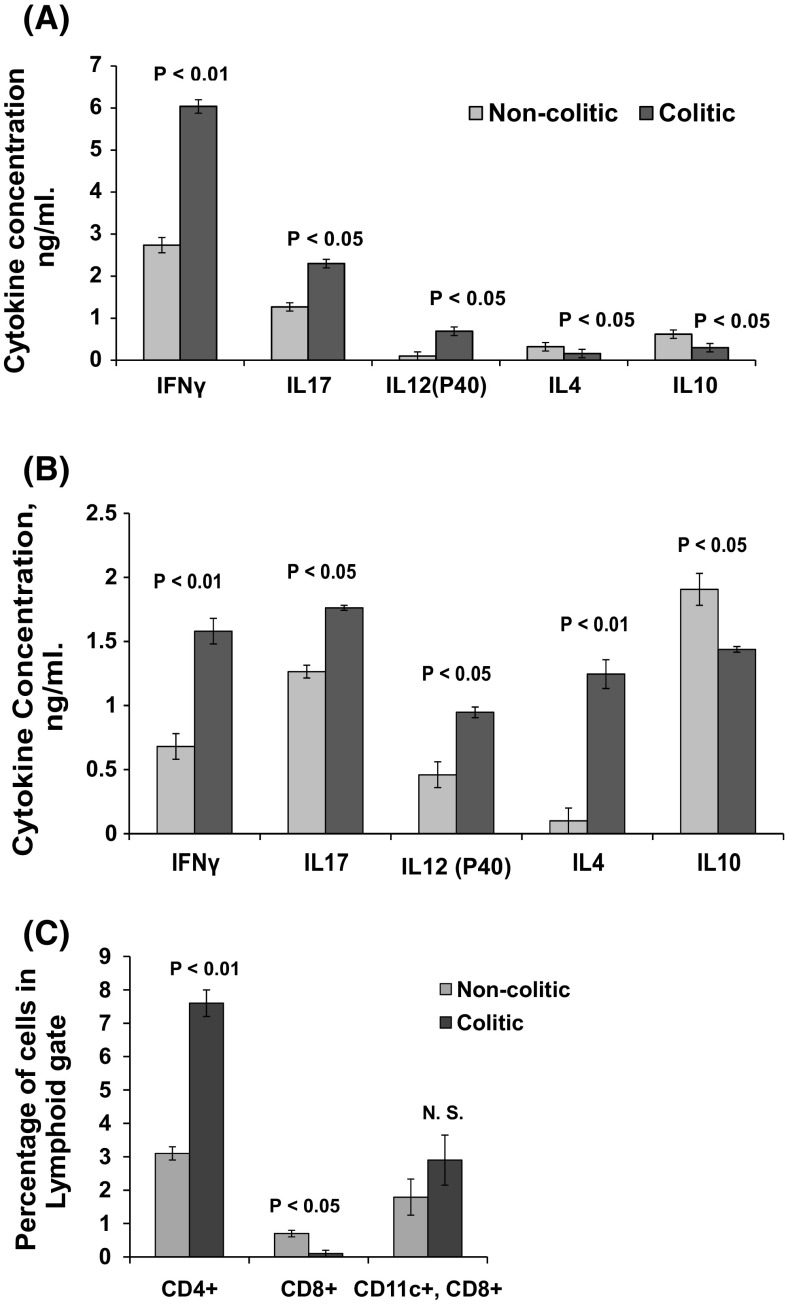
Fig. 3.
ELISA analysis of cytokines in culture supernatants of LPL from colitic and non-colitic mice stimulated in vitro with anti-CD3, (a) was mimicked by their lung lymphocytes counterparts (b) with the only exception in enhanced production of IL4. c Is a graph representing the distribution of CD4+, CD8+ and CD11c+, CD8+ in lung cell preparations from colitic and non-colitic mice. The figures represent means and standard errors from three independent experiments

