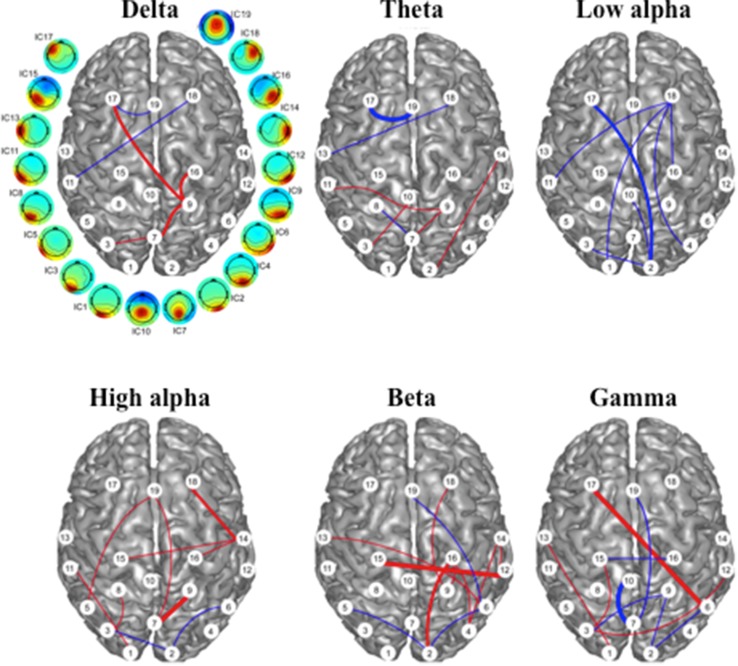
Fig. 3.
Intrinsic functional connectivity changes correlated to VAS score change following rTMS. Red and blue lines indicate positive and negative correlations, respectively. Red: connectivity decreases with symptom improvement; blue: connectivity increases with symptom improvement. The weight of the lines represents levels of significance: heavy: p < 0.005, medium: p < 0.01, light: p < 0.05. White circles with numbering indicate the ICs noted in Fig. 2

