Figure 1.

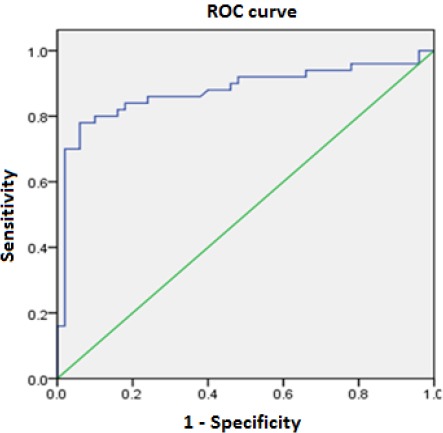
ROC curve of serum alpha-fetoprotein for the diagnosis of hepatocellular carcinoma. The green line corresponds to the 1:1 correlation between two parameters

ROC curve of serum alpha-fetoprotein for the diagnosis of hepatocellular carcinoma. The green line corresponds to the 1:1 correlation between two parameters