
Figure 4.
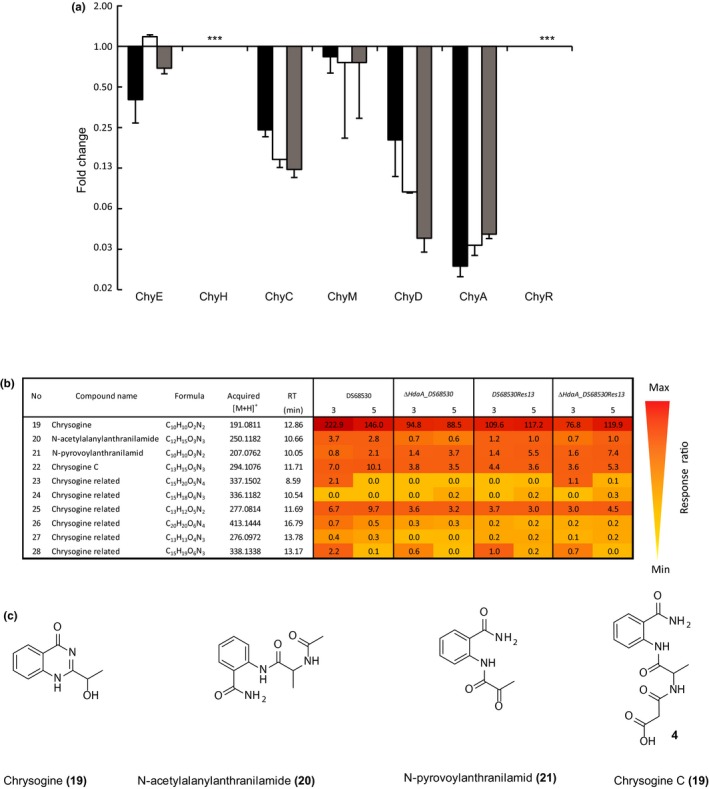
Transcriptional and metabolite profile analysis of chrysogine biosynthetic gene cluster in ∆hdaA mutant. (a) Quantitative real‐time PCR analysis of chrysogine gene cluster. Strains: DS685Res13 (black bars), ΔhdaA_DS68530Res13 (white bars), ΔhdaA_DS68530 (gray bars). Samples were taken after 3 days of growth on SMP medium. Data are shown as a fold change relative to P. chrysogenum DS68530 (∆hdaA/DS68530). (*) Indicates nondetected expression under the tested strain. (b) Response ratio on the concentration of the chrysogine‐related compounds in the culture broth of the indicated P. chrysogenum strains. Samples were collected after 3 and 5 days of growth in SPM medium. (c) Chrysogine‐related compounds (with known chemical structure) detected in this study. Reserpine was used as internal standard for normalization. The mass‐to‐charge ration (m/z) of the protonated metabolites, retention time, and empirical formulas are described. Error bars indicate the standard deviation of two biological replicates with two technical replicates