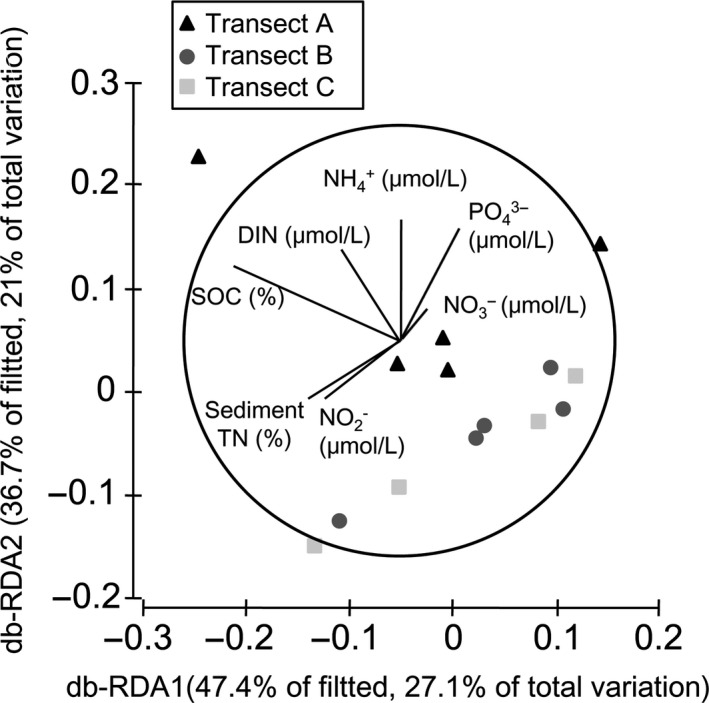
Figure 3.

Distance‐based Redundancy Analysis (db‐RDA) ordination of microbial community data (Weighted UNIFRAC resemblance matrix calculated from relative abundance data) fitted to environmental variables. The plot represents a db‐RDA ordination based upon the Bray–Curtis distance of all the sampling sites. Correlations can be found in Table 2
