Figure 4.

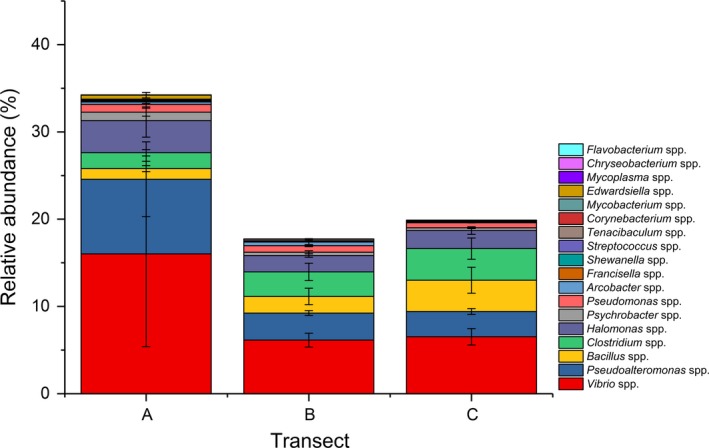
Presence of putative pathogens at the genus level averaged over the three transects. Values show means and 1 standard error (n = 4–5). Relative abundances at each site are provided in Figure S2

Presence of putative pathogens at the genus level averaged over the three transects. Values show means and 1 standard error (n = 4–5). Relative abundances at each site are provided in Figure S2