. 2018 Aug 28;9(39):7642–7655. doi: 10.1039/c8sc02239a

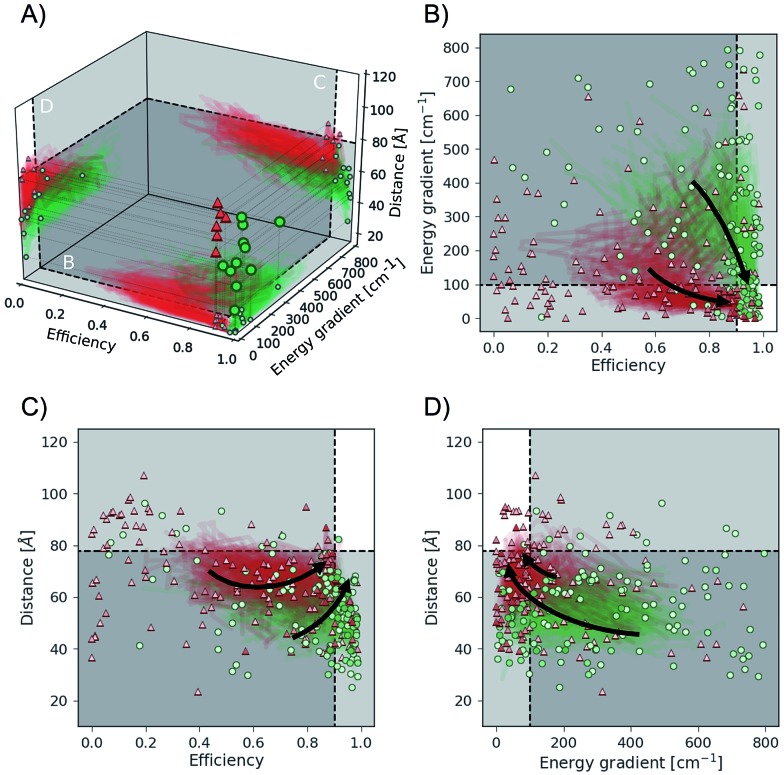
Fig. 6. Objective function values sampled in optimization runs with two different hierarchies in the objective. Hierarchy order shown in green dots: (i) transfer efficiency, (ii) energy gradient, (iii) total distance. Hierarchy order shown in red triangles: (i) energy gradient, (ii) transfer efficiency, (iii) total distance. (A) Optimal points with respect to all objectives discovered during individual optimizations. Projections illustrate bootstrapped sampling paths leading to the best performing points. (B–D) Detailed illustration of projected sample traces. Arrows indicate the general paths taken by the optimization algorithm for the different hierarchy orders. More transparent points have been sampled earlier in the optimization procedure, and more opaque points have been sampled at a later stage. White regions indicate the target values for all considered objectives.

Fig. 6