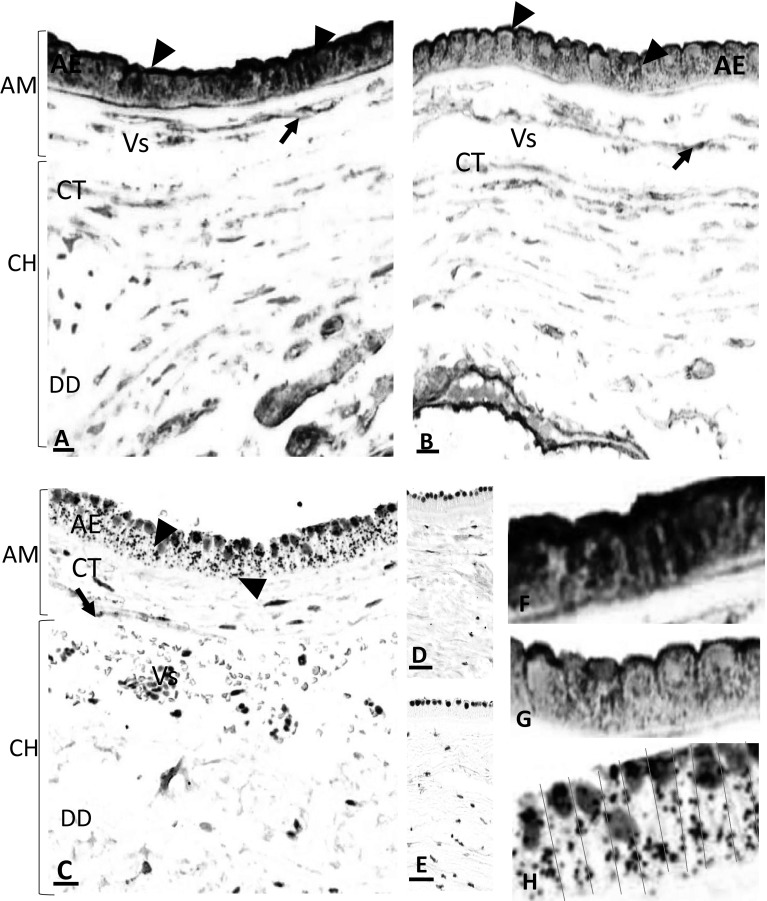
Fig. 1.
Location of AnxA2, S100A10 and the AnxA2/S100A10 complex in the amniotic membranes. Parallel sections from the same placental block were stained for AnxA2 (a, f), S100A10 (b, g) or the AnxA2/S100A10 complex (c, h). AnxA2 and S100A10 staining is in brown, the proximity ligation signal is represented as brown dots and haematoxylin counterstaining is in blue. Representative images are shown. d, e are negative controls showing absence of the positive signals. The amniotic epithelium (AE), amniotic connective tissue (CT) containing blood vessels (Vs) and their endothelial lining (arrows), Chorion (CH) and Decidua (DD) are indicated. Arrowheads indicate apical and junctional staining of epithelial cells. Scale bars: a–c 25 µm. d, e 5 µm

