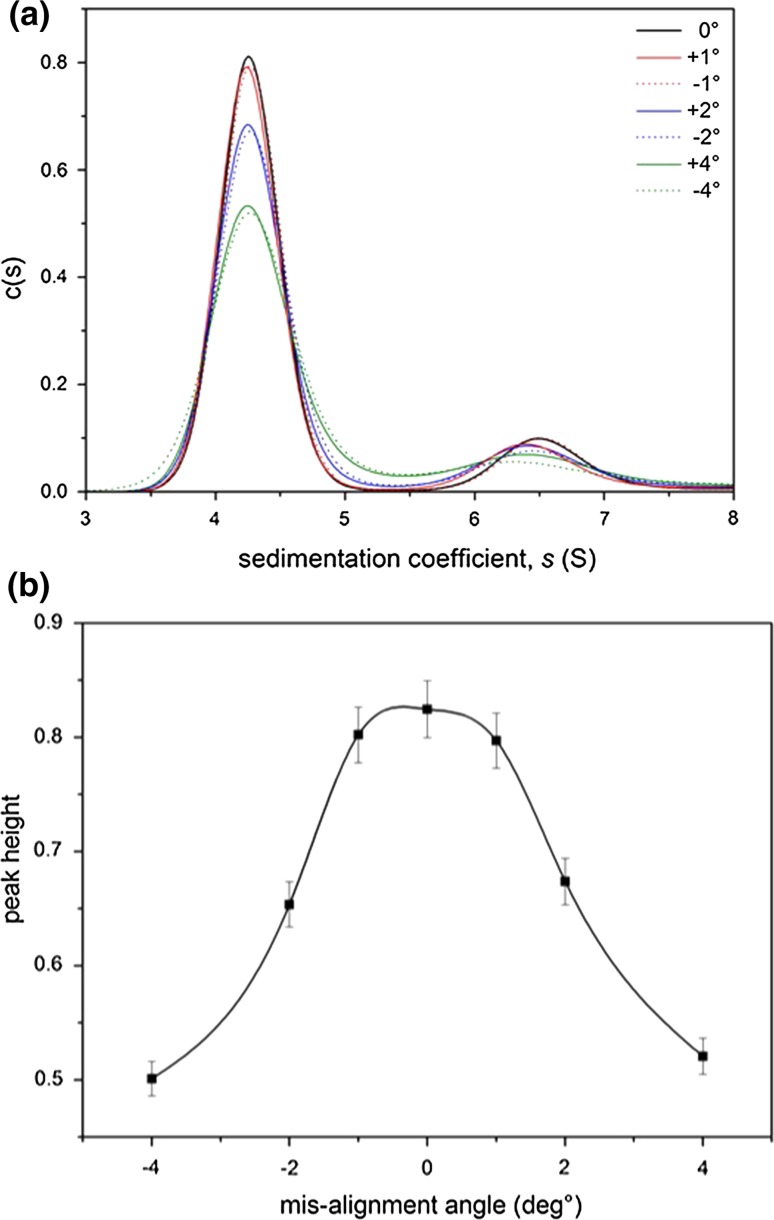
Fig. 4.
Effect of misalignment. a Sedimentation coefficient distribution plot for 0.7 mg/mL bovine serum albumin in phosphate–chloride buffer (pH 6.8, I = 0.1) for a range of misalignment angles. b Monomer peak height as a function of misalignment angle. The average value and standard error for 0° is shown and is assumed by % the same for the misaligned angles

