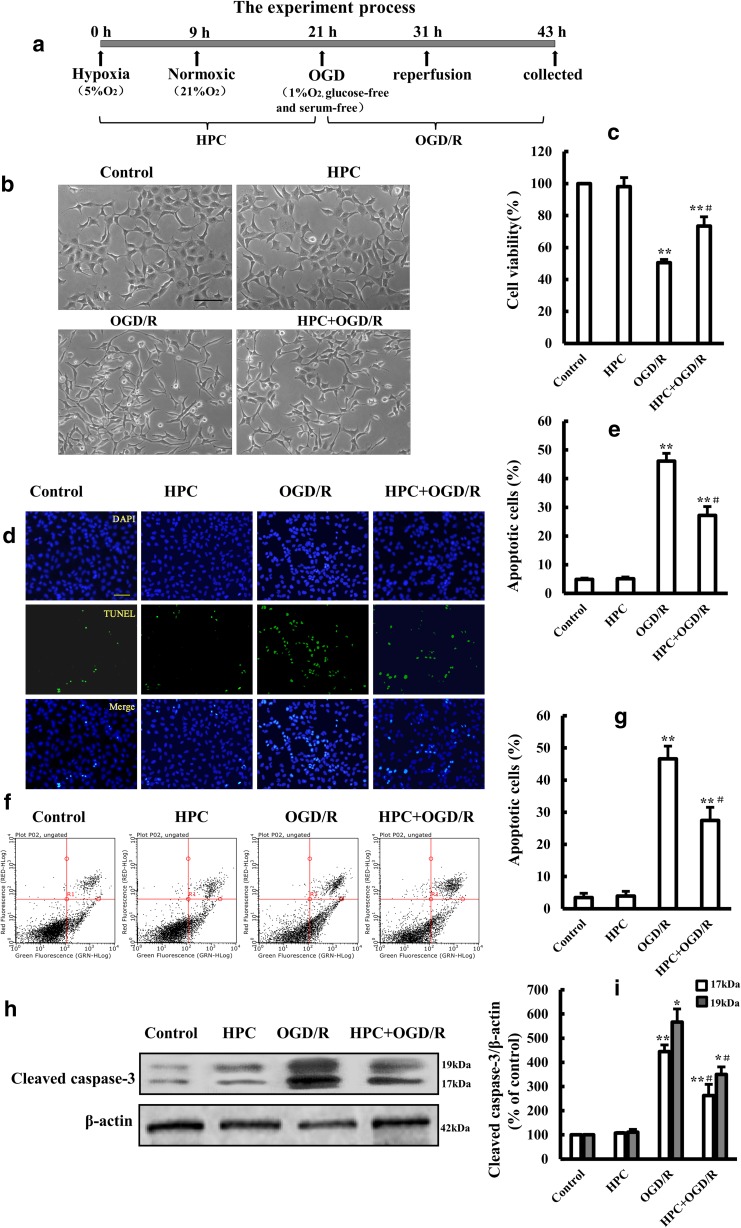
Fig. 1.
Effects of HPC on OGD/R-induced injury in SH-SY5Y cells. a Schematic diagram illustrating the HPC and OGD/R treatment of SH-SY5Y cells. b Representative microscopic images showing the cell morphology of control cells and cells subjected to OGD/R with or without prior treatment with HPC. Scale bar is 100 μm. c Summary of the mean cell viability determined by MTT from three independent experiments using six wells of cells in each experiment. d, e TUNEL analysis of cell apoptosis. Representative fluorescence microscopic images showing TUNEL staining (green) and DAPI nuclear staining (blue). Scale bar is 100 μm. f, g Analysis of cell apoptosis using flow cytometry under the conditions indicated above. h, i Representative Western blot showing the expression of cleaved caspase-3 proteins in SH-SY5Y cells under the indicated conditions and summary of the mean ± SD data from three independent experiments. *P < 0.05, **P < 0.01 vs. control group; #P < 0.05 vs. OGD/R group

