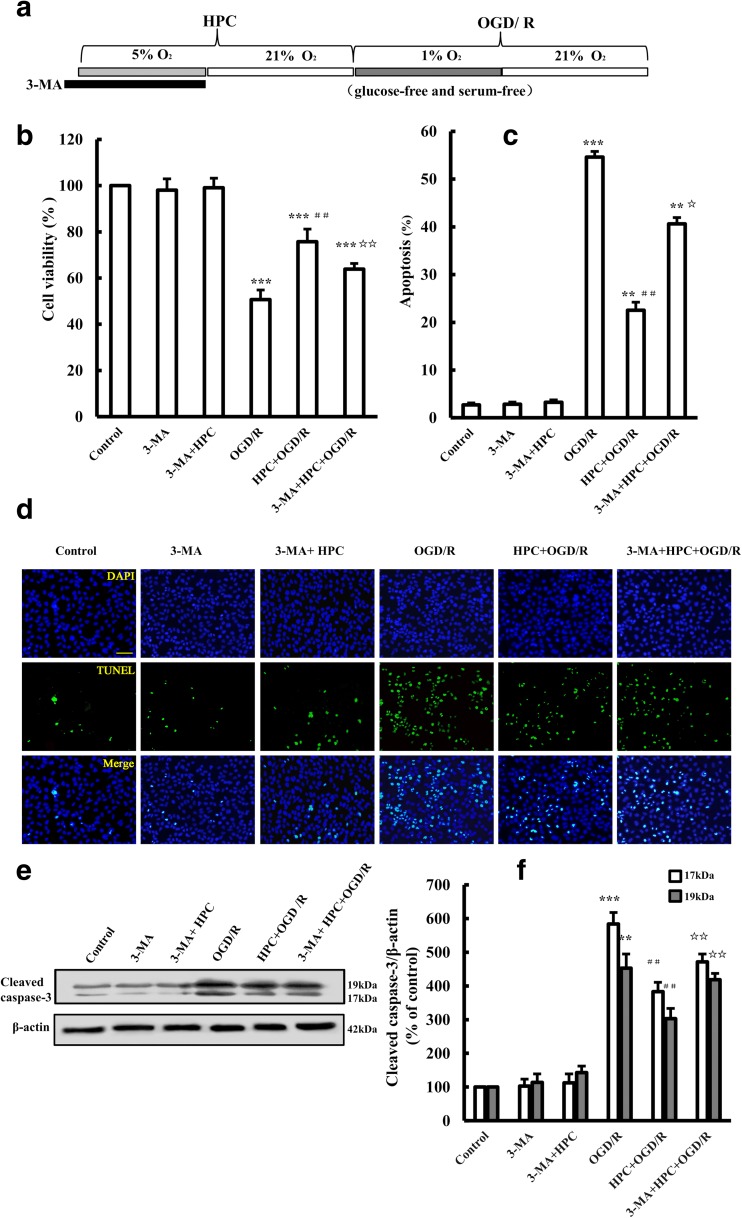
Fig. 4.
Effect of the autophagy inhibitor 3-MA on HPC-induced neuroprotection in SH-SY5Y cells. a Schematic diagram showing the treatment of SH-SY5Y with 10 mM 3-MA for 30 min before HPC followed by OGD/R. b Summary of the mean cell viability determined by MTT, under the conditions shown in a, from three independent experiments with six wells of cells in each experiment. c, d Representative fluorescent images showing TUNEL staining (green), DAPI nuclear staining (blue), and merged images under the conditions shown in a. Scale bar is 100 μm. Summary of the percentage of TUNEL-positive dead cells, as shown in b, from at least three independent experiments with at least three different images analyzed in each experiment. e, f Western blotting showing the expression of cleaved caspase-3 protein in SH-SY5Y cells. Data are shown as the mean ± SD from three independent experiments. **P < 0.01, ***P < 0.001 vs. control group; ##P < 0.01 vs. OGD/R group; ☆P < 0.05, ☆☆P < 0.01 vs. HPC + OGD/R group

