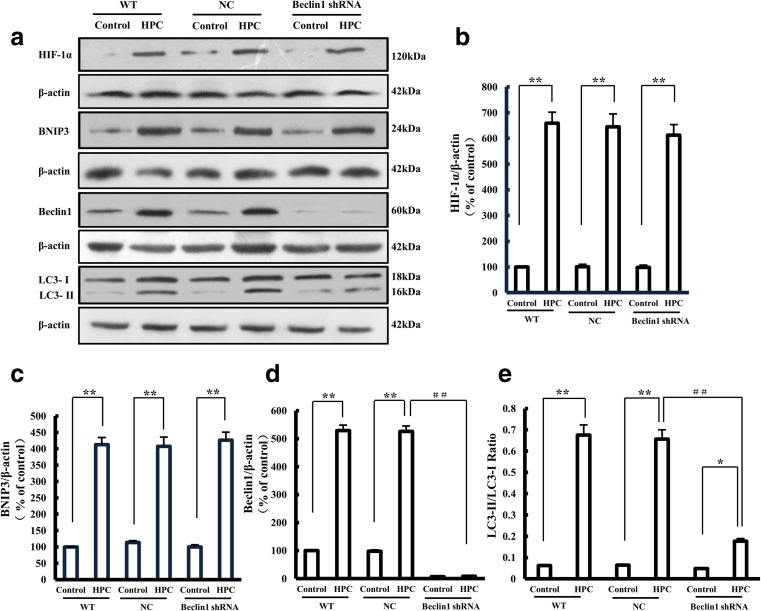
Fig. 7.
Effect of Beclin1-shRNA on HPC-induced HIF-1α, BNIP3, Beclin1, and LC-3 protein expression in SH-SY5Y cells. a Western blots showing the expression of HIF-1α, BNIP3, Beclin1, and LC-3 proteins after Beclin1-shRNA transfection of SH-SY5Y cells with HPC treatment. b–e Graphs showing the mean results for relative optical density of protein bands on the blots, estimated using ImageJ software. Data are shown as the mean ± SD from three independent experiments. *P < 0.05, **P < 0.01 vs. control group; ##P < 0.01 vs. HPC group of negative control (NC) cells

