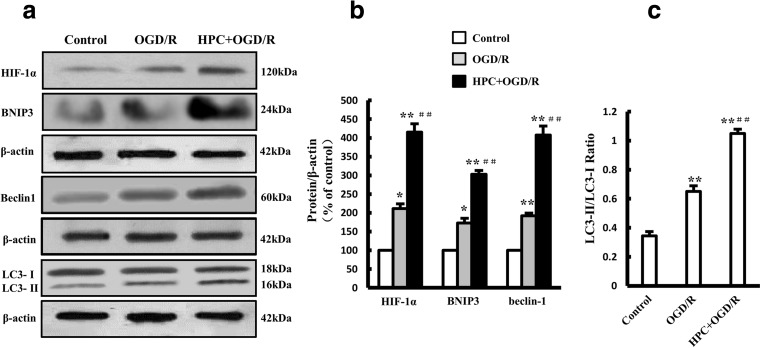
Fig. 8.
Effect of HPC on LC-3 and the HIF-1α/BNIP3/Beclin1 signaling pathway in OGD/R-treated SH-SY5Y cells. a Western blots showing the expression of HIF-1α, BNIP3, Beclin1, and LC-3 proteins. b, c Graphs showing the mean results for relative optical density of protein bands on the blots, estimated using ImageJ software. Data are shown as the mean ± SD from three independent experiments. *P < 0.05, **P < 0.01 vs. control group; ##P < 0.01 vs. OGD/R group

