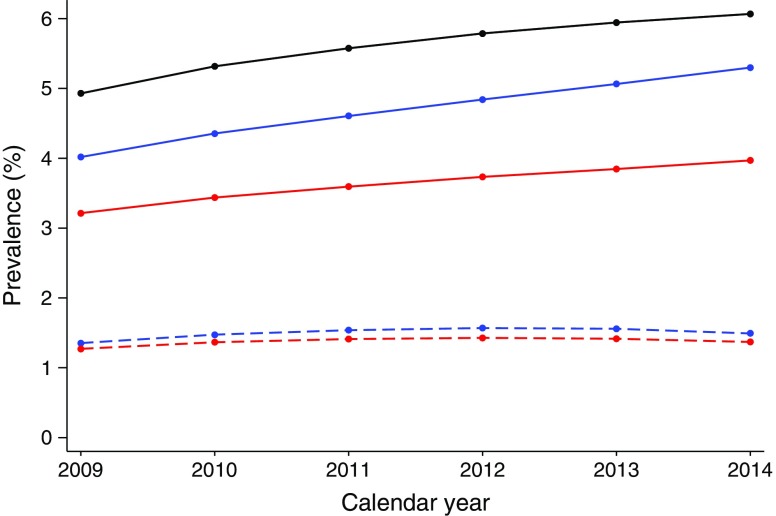
Fig. 1.
Time trends in proportion of people diagnosed with type 2 diabetes in the population aged 30–89 years in Norway from 2009 to 2014, in all participants and by treatment and sex. Black line, all participants; blue lines, men; red lines, women; solid lines, pharmacologically treated; dashed lines, non-pharmacologically treated

