Fig. 1.
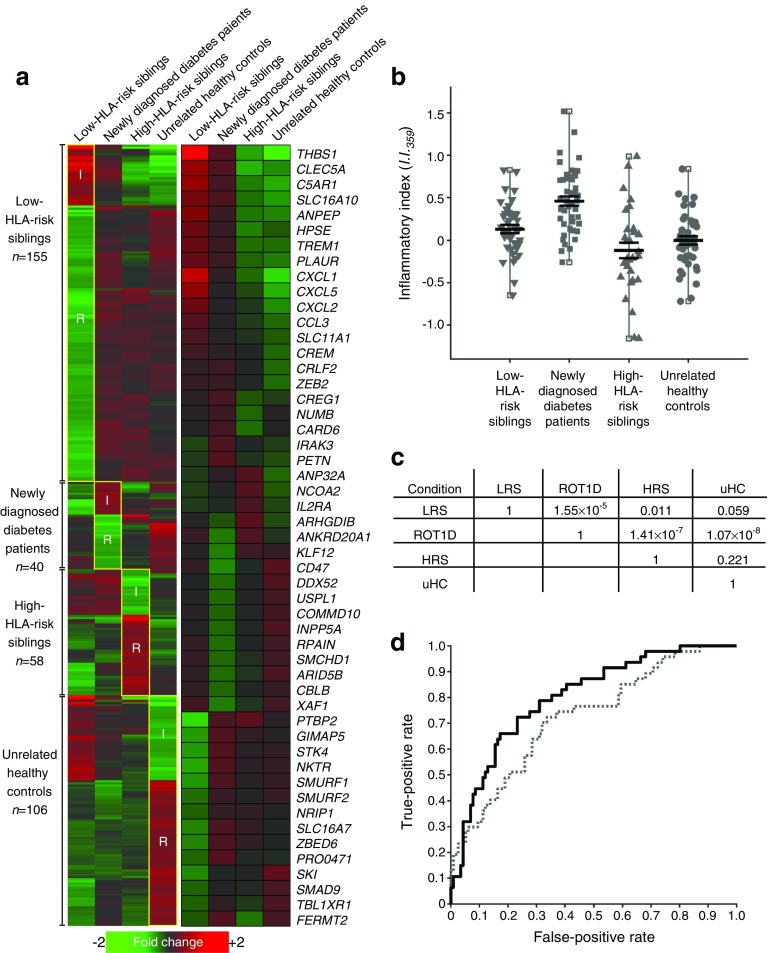
Refined scoring of plasma-induced transcriptional signatures. (a) Mean expression levels of the 359 probe sets that best distinguish individuals newly diagnosed with type 1 diabetes from the low-HLA-risk sibling, high-HLA-risk sibling, and unrelated healthy control cohorts. The analysis included: individuals with diabetes (n = 47, age 10.0 ± 2.9 years, blood glucose 8.6 ± 4.1 mmol/l, HbA1c 5.8 ± 9.3 mmol/mol [7.5 ± 1.2%]; baseline samples were collected 2–7 months after diagnosis when metabolic control had been achieved); low-HLA-risk siblings (n = 42, age 8.4 ± 2.0 years, blood glucose 5.2 ± 0.9 mmol/l); high-HLA-risk siblings (n = 30, age 8.6 ± 1.9 years, blood glucose 5.2 ± 0.7 mmol/l); and unrelated healthy control individuals (n = 44, age 15.0 ± 4.1 years, blood glucose 5.1 ± 0.7 mmol/l). Random forest analysis used 12,589 probe sets identified in the six possible comparisons between the four cohorts at a fold change >1.1 and an FDR <20%. The probe sets that exhibited a random forest Gini score >3.49 when any one group was compared with the three others were retained. A second analysis identified probe sets that were regulated at log2 ratio >|0.263| (1.2-fold) and FDR <20% when one cohort was compared with any of the three others. A total of 359 transcripts met both criteria. (a) The left section shows the relative expression levels of the 359 probe sets across the four cohorts. The second analysis enabled the definition of four data subsets, the number of transcripts within each data subset is shown on the left. The transcripts generally annotated as inflammatory and regulatory within each data subset are indicated; the upregulated transcripts in the low-HLA-risk sibling and diabetic individual data subsets are generally annotated as inflammatory, while upregulated transcripts in the high-HLA-risk sibling and unrelated healthy control data subsets are generally annotated as regulatory. The annotated dataset is available from the corresponding author on request. The right section shows the mean expression levels of a subset of well-annotated transcripts. (b) Ontology-based scoring of cross-sectional samples using I.I.359 significantly discriminates the diabetic cohort from the other cohorts. The mean I.I.359 for the 47 cross-sectional diabetes participants (mean ± SE 0.46 ± 0.05) was significantly higher than that observed for the 42 siblings with low HLA risk (0.13 ± 0.05), 30 siblings with high HLA risk (−0.12 ± 0.09) and 44 unrelated healthy control participants (0.00 ± 0.05). p values are shown in panel (c); two-tailed unpaired t tests for the comparisons between each cohort. (d) ROC curve for 359 probe sets (solid line; AUC = 0.80) shows improved discrimination of the diabetic cohort from the related and unrelated control cohorts compared with the previously reported 1374 probe sets described in Chen et al [22] (dotted line; AUC = 0.72). ROT1D, recent-onset type 1 diabetes; LRS, low-HLA-risk sibling; HRS, high-HLA-risk sibling; I, inflammatory; R, regulatory; uHC, unrelated healthy control group

