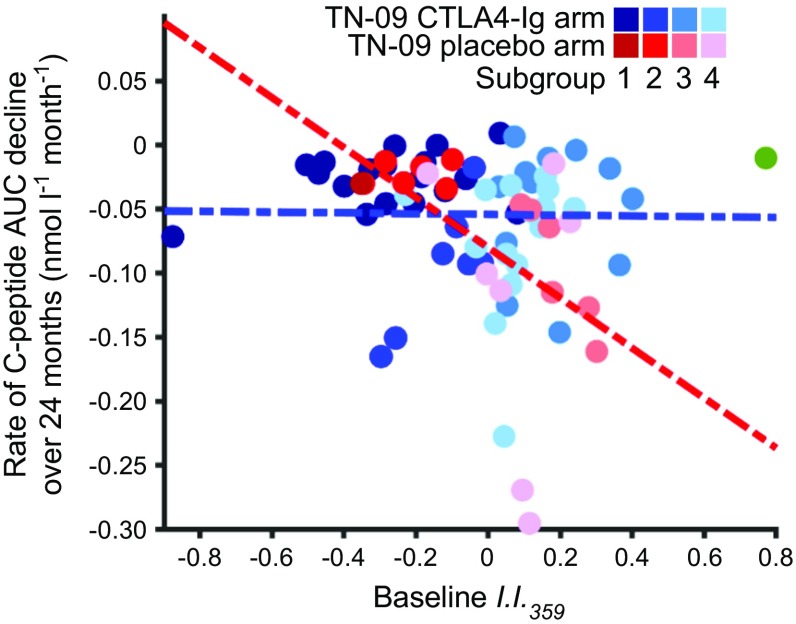
Fig. 8.
Type 1 diabetes subgroups exhibit different rates of C-peptide decline and responses to CTLA4-Ig treatment. A significant inverse relationship between baseline I.I.359 and the rate (slope) of C-peptide decline in placebo-treated TN-09 participants is described in Fig. 2f. Here, this relationship is considered from the perspective of subgroups 1–4. The green data point is the outlying CTLA4-Ig participant not assigned to a subgroup (left-most participant in Fig. 6d). Regression lines are shown for the CTLA4-Ig and placebo arms of TN-09 in blue and red, respectively

