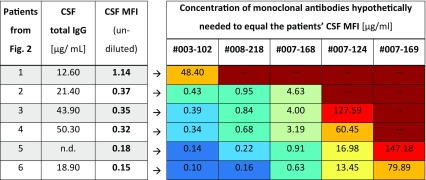
Table 2.
Concentrations of monoclonal human NR1 autoantibodies calculated from binding curves to cause an MFI that is identical to the MFI of undiluted CSF samples
The heat map (right) shows for each monoclonal antibody which concentration would hypothetically be required to reach the fluorescence intensity of undiluted CSF for each patient (left). Low concentrations of high-affinity monoclonal antibodies (dark blue to turquoise) are sufficient to explain the MFI of most undiluted CSF samples from patients with NMDAR encephalitis (e.g., #003-102 for patients 2–6). In contrast, concentrations of low-affinity antibodies (e.g., #007-169, extreme right lane) needed to receive the same signal would often exceed the total IgG concentration in the patients’ CSF (antibody concentrations in orange to dark red) and can therefore not explain the antibody signal in the patient sample
n.d. not determined

