Fig. 6.
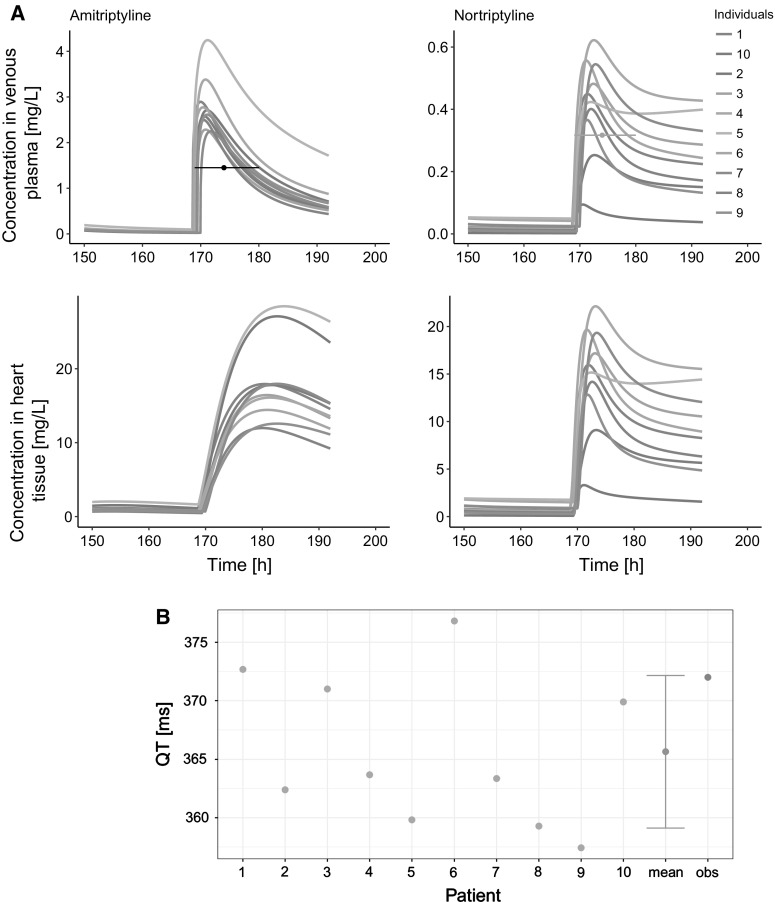
The exemplary individual results of PBPK and PBPK-QSTS modeling in case of 67-year old female intoxicated with 2500 mg of AT [34]. a The 1st column contains profiles of AT concentrations, the 2nd has NT concentrations. The 1st row has drug concentrations in venous plasma, the 2nd has drug concentrations in the heart tissue. The black and orange horizontal lines depict the measured concentration of AT, and NT, respectively, and the time interval in which the measurement was conducted. b The QT interval length simulated in CSS in ten Tusscher and Panfilov [26] ventricular cardiomyocyte cell model (results of single simulations in green, mean of simulation results in blue) compared to clinically observed value (in orange) (Color figure online)

