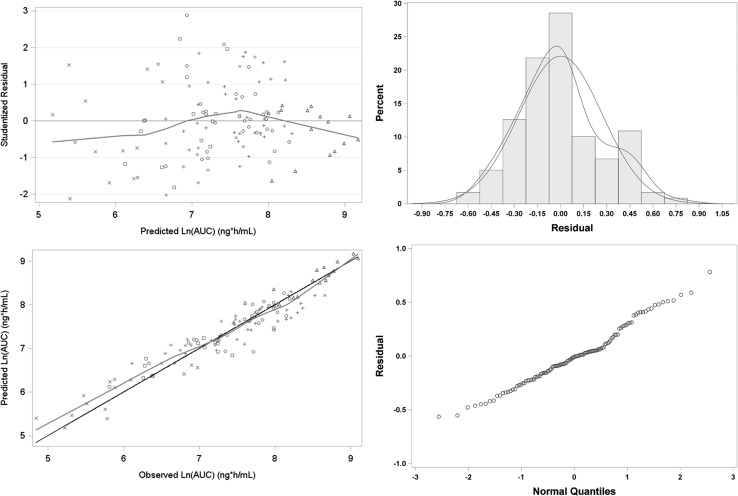
Fig. 3.
Goodness of fit plot for L-PZQ AUC model for Study 200585-001. Upper left: red line is the LOESS smooth to the data. Symbols are by treatment. Upper right: blue line is standard normal distribution, red line is kernel smooth to the empirical data. Lower left: black line is line of unity, red line is LOESS smooth. Symbols are by treatment. Lower right: QQ plot of residuals; blue line is theoretical normal distribution line

