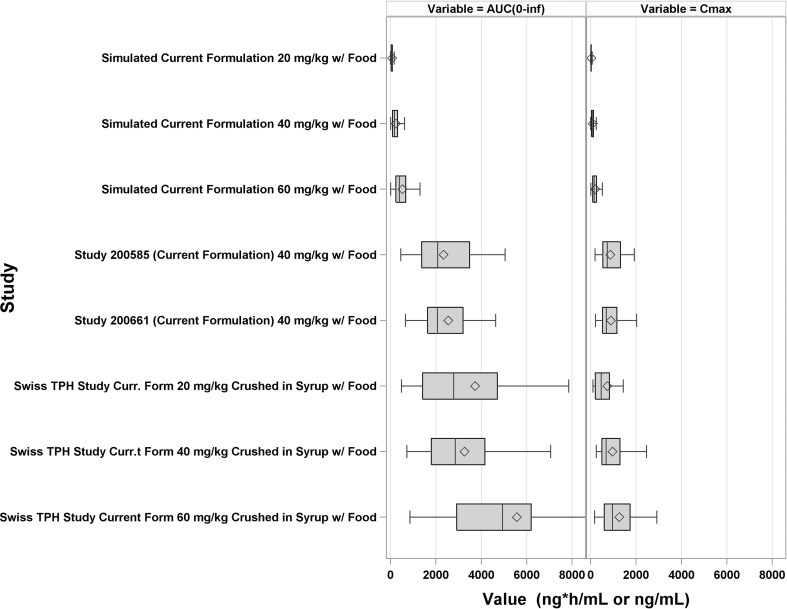
Fig. 5.
Forest plot comparing the observed L-PZQ AUC in Study 200585-001, Study 200661-001, and the Swiss Tropical and Public Health Institute Study to simulated AUCs based on the model developed using Study 200661-00. Each box is the 1st and 3rd quartile. The middle line in the box is the median (2nd quartile). The diamonds are the mean. The whiskers are 1.5 times the inter-quartile range

