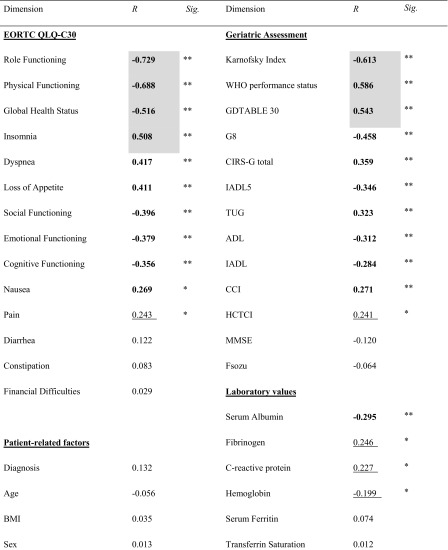
Table 2.
Association between fatigue and demographic data, geriatric impairments, and laboratory parameters
Correlation coefficients based on Spearman rho analysis are shown. High correlation coefficients (> 0.5) are bold and grey, moderate correlation coefficients (> 0.25) are bold, and weak correlation coefficients (> 0.15) are underlined. Statistically highly significant P < 0.001**; statistically significant P < 0.05*
G8–G8 screening questionnaire, BMI body mass index, ADL activities of daily living, IADL instrumental activities of daily living, GDS 30 geriatric depression scale 30, Fsozu Fragebogen zur sozialen Unterstützung, MMSE mini mental state examination, CCI Charlson comorbidity index, HCTCI hematologic cell transplantation comorbidity index, CIRS cumulative illness rating scale for geriatrics, TUG Timed Up and Go

