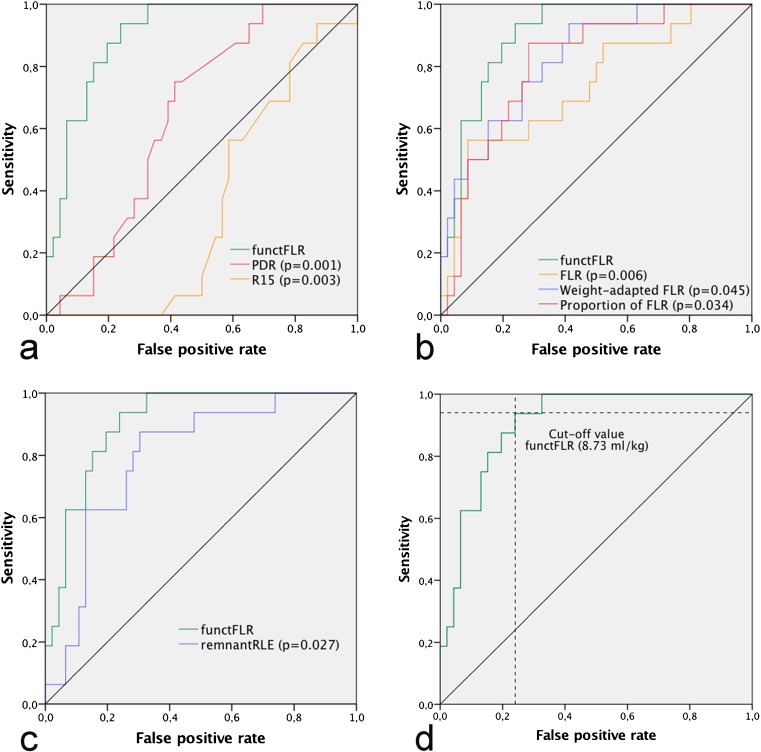
Fig. 3.
Receiver operating characteristic curves for the prediction of PHLF, comparing functFLR to a established clinical variables, b established MDCT variables and c an established gadoxetic acid enhanced variable. Corresponding p values are given in parentheses. d Optimal cut-off point defined as a functFLR of 8.73 ml/kg, demonstrated a sensitivity and specificity of 94% and 76%

