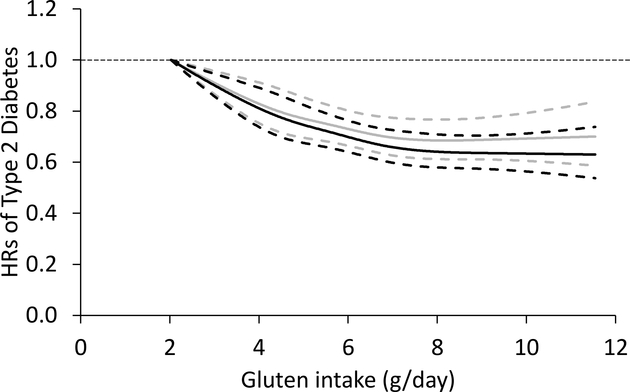
Fig. 2.
Restricted cubic spline analysis of the association between gluten intake (g/day) and risk of type 2 diabetes. Adjusted for age, ethnicity (white, African-American, Asian and other ethnicity), family history of diabetes (yes/no), smoking status (never, former, current [1–14, 15–24, or ≥ 25 cigarettes/day], or missing), alcohol intake (g/day: 0, 0.1– 4.9, 5.0–14.9, and ≥ 15.0 in women; 0, 0.1–4.9, 5.0–29.9, and ≥ 30.0 in men; or missing), physical activity (<3.0, 3.0–8.9, 9.0–17.9, 18.0–26.9, ≥ 27.0 METs, or missing), menopausal status and postmenopausal hormone use (pre-menopause, postmenopause [never, former, or current hormone use], or missing, for women), oral contraceptive use (yes, no, or missing, for NHSII), multivitamin use (yes/no), BMI (<23.0, 23.0–24.9, 25.0–29.9, 30.0–34.9, ≥ 35.0 kg/m2, or missing), total energy intake, AHEI, folic acid intake (in quintiles), and magnesium intake (in quintiles). Solid lines, point estimates; dashed lines, 95% CIs; black lines, estimates before further adjustment of cereal fibre; grey lines, estimates with further adjustment of cereal fibre

