Fig. 3.

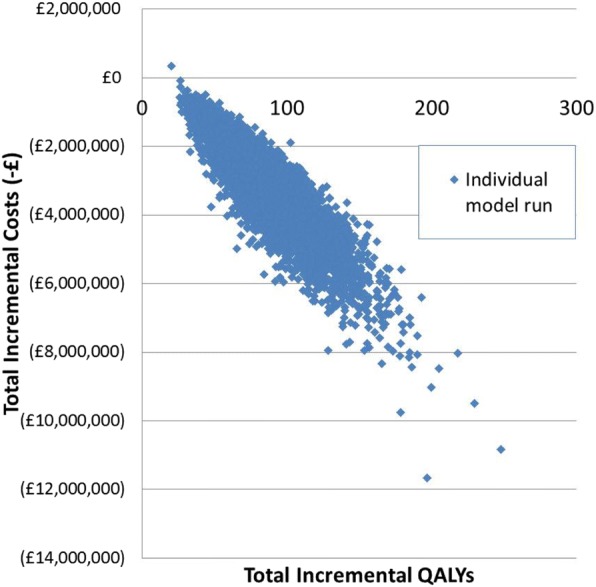
Cost-Effectiveness Plane. Each of the blue diamonds represents one of the 100,000 model runs. Costs in () represent model runs where screening is estimated to be cost saving

Cost-Effectiveness Plane. Each of the blue diamonds represents one of the 100,000 model runs. Costs in () represent model runs where screening is estimated to be cost saving