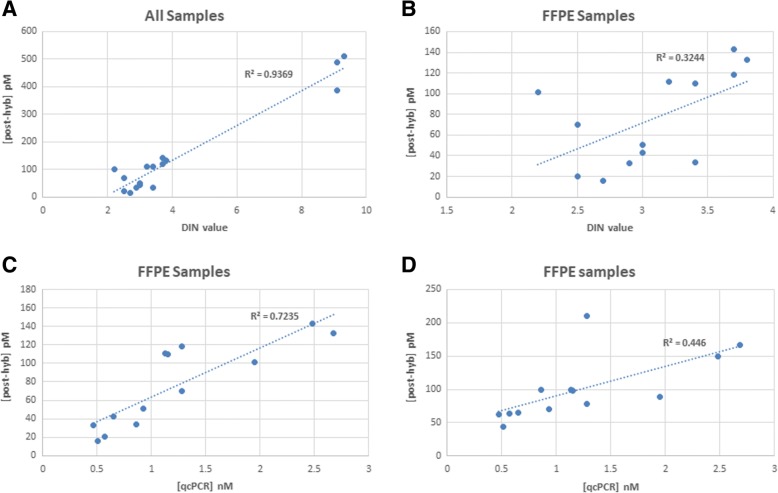
Fig. 6.
Correlations. a Correlation between post-hyb concentration measured by QPCR and DIN value for all samples. b Correlation between post-hyb concentration measured by QPCR and DIN value for FFPE samples. c Correlation between post-hyb concentration measured by QPCR and qcPCR concentration measured with Tape Station for FFPE samples. d Correlation between post-hyb concentration and qcPCR concentration measured, both with Tape Station, for FFPE samples

